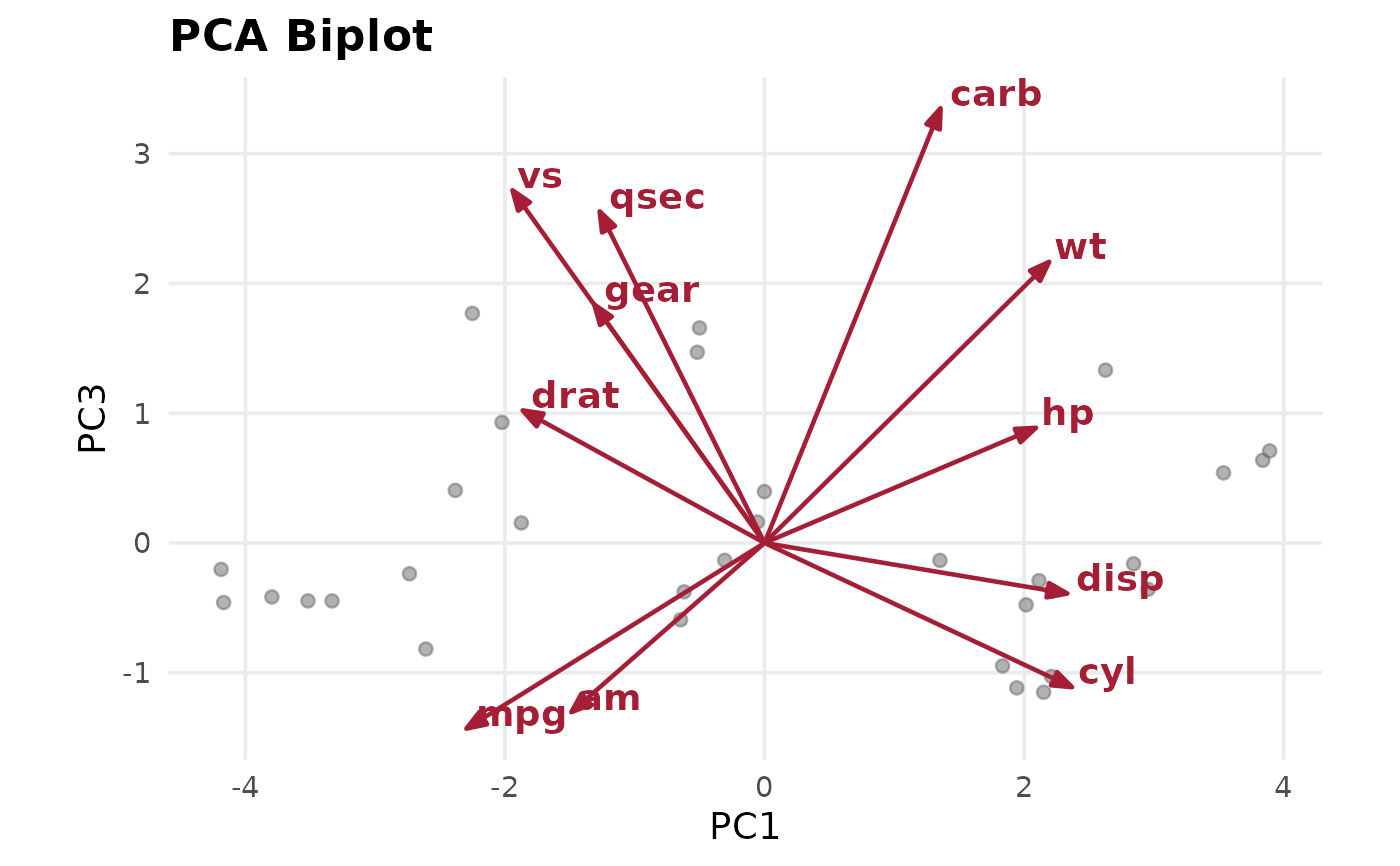
One entry point to this package's PCA plots.
Usage
pca_plot(
  pca_model,
  type = c("variance", "heatmap", "bi", "biplot", "scree", "circle"),
  ...
)
Arguments
- pca_model
A
prcompobject orcbe_pcaobject fromrun_pca. (Not `x`, which would capture the `x` component argument of `type = "bi"` and `"biplot"`.)- type
One of
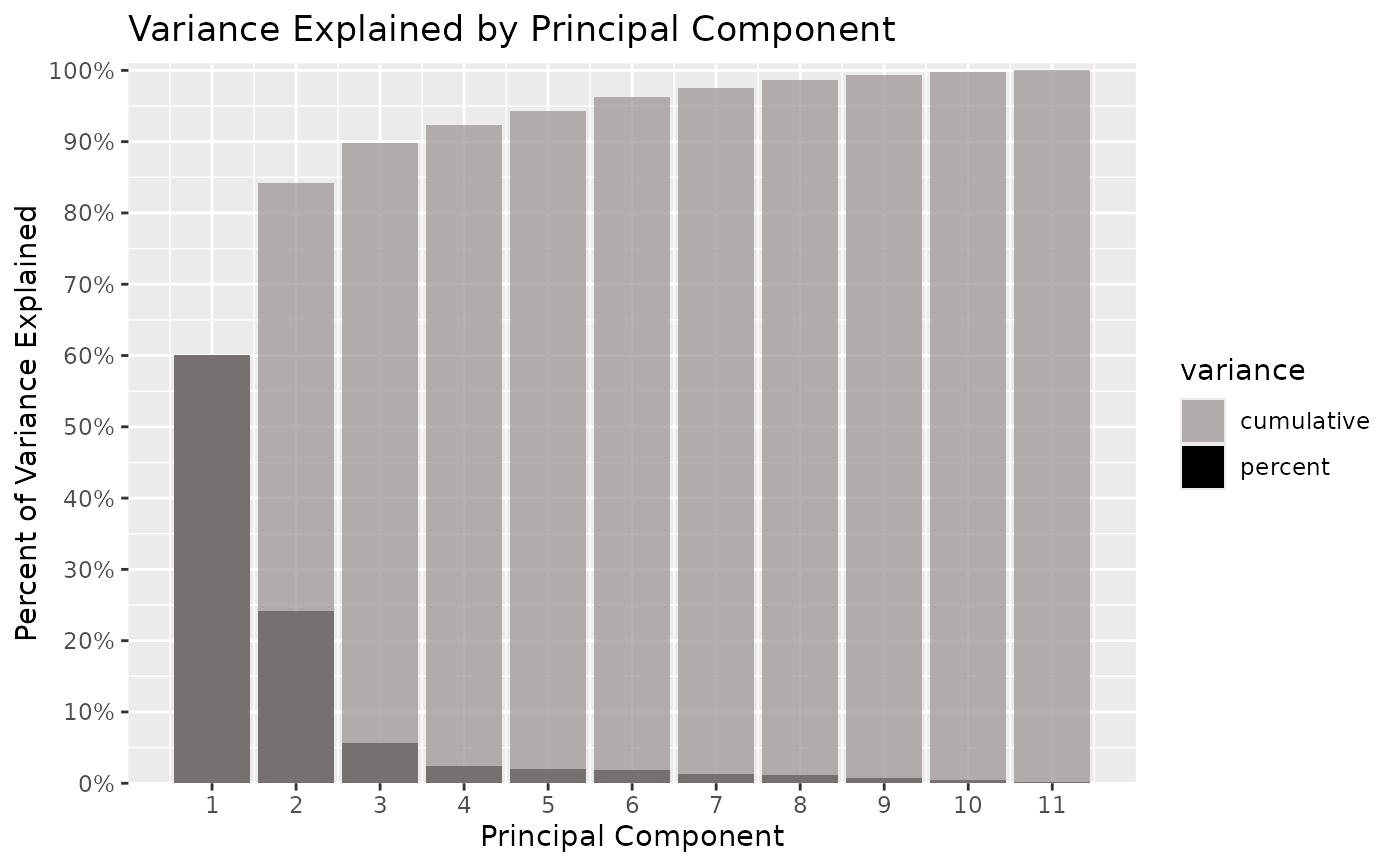
"variance"(pca_percent_var_explained),"heatmap"(pca_feature_loading_heatmap),"bi"(plot_pca_bi),"biplot"(pca_biplot),"scree"(pca_scree_plot), or"circle"(pca_variables_plot).- ...
Passed on to the underlying plot function (needed for
type = "bi", which requiresnewdataandcolumn; and optionally used bytype = "bi"or"biplot"to pick components withx/y).
Details
This is an ordinary function rather than a `plot()` method: stats already registers `plot()` for `prcomp` objects (a scree plot), and a package that replaces another package's method for a class it doesn't own changes `plot()` for everyone who loads it. Call `pca_plot(x, type = )`, or [stats::screeplot()] for the base scree plot.
Examples
pca_model <- prcomp(mtcars, center = TRUE, scale. = TRUE)
pca_plot(pca_model, type = "variance")
 pca_plot(pca_model, type = "biplot", x = 1, y = 3)