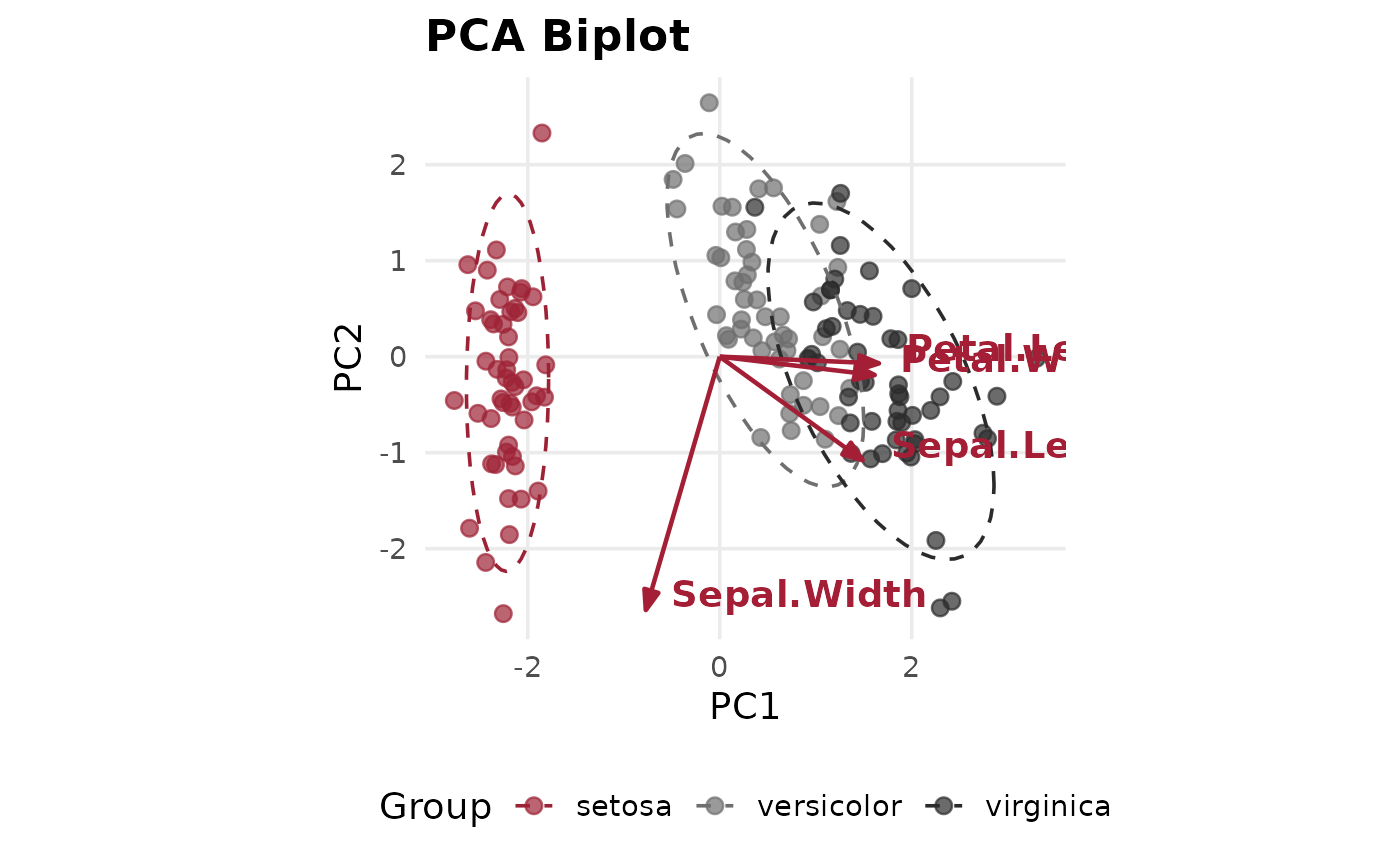
A classic PCA biplot: the observation scores (pca_model$x) overlaid with
variable loading vectors (pca_model$rotation) drawn as labeled arrows from the origin.
Observations can optionally be colored by a categorical grouping variable with 95%
concentration ellipses.
Usage
pca_biplot(
  pca_model,
  x = 1,
  y = 2,
  group = NULL,
  ellipse = FALSE,
  title = "PCA Biplot",
  percent = FALSE
)
Arguments
- pca_model
- x, y
Which principal components to plot on the x/y axes (default 1, 2).
- group
Optional categorical vector (e.g.
iris$Species) to color observations by.- ellipse
Logical (default
FALSE); ifTRUEandgroupis provided, draws 95% confidence/concentration ellipses around each group.- title
Optional plot title (default
"PCA Biplot").- percent
Logical (default
FALSE); ifTRUE, appends percent variance explained to axis labels.
Details
Loading vectors are unit-scale by construction and would be invisible next to the score cloud if plotted as-is, so they are rescaled so that their maximum extent is 80% of the score cloud's maximum extent (a standard biplot convention) before being drawn.
Examples
pca_model <- prcomp(iris[, 1:4], center = TRUE, scale. = TRUE)
pca_biplot(pca_model, group = iris$Species, ellipse = TRUE)