
04. Validation and Workflow Guide for SAS Users: Cox Models in TempleCBE
J Kyle Armstrong
Source:vignettes/sas_survival.Rmd
sas_survival.RmdIntroduction: Bridging SAS PROC PHREG and R
In regulated clinical trials and academic biostatistics, SAS
PROC PHREG has long been a gold standard for Cox
proportional hazards modeling. As modern clinical pipelines increasingly
adopt R, biostatisticians and statistical programmers need two critical
assurances:
- Exact Numerical Parity: Confidence that survival models fit in R reproduce the parameter estimates, standard errors, test statistics, and hazard ratios computed by SAS.
-
Workflow Translation: Clear mappings from familiar
SAS statements (
CLASS,MODEL,BASELINE,ASSESS,OUTPUT) and DATA-step macros to concise, production-ready R workflows.
The TempleCBE package is designed to streamline survival
analysis with univariable screening (cox_single()),
multivariable modeling (cox_multi()), automated
proportional hazards assumption validation (cox_check()),
factor reference leveling (relevel_factor()), presentation
tables (cbe_cox_table()), and specialized ggplot2
visualizations (plot_cox_forest(),
plot_cox_survival(), plot_cox_marginal()).
This vignette demonstrates:
-
@sec-part1 — Univariable and
multivariable time-fixed survival workflows using the public
survival::lungdataset, illustrating SAS-to-R syntax equivalencies. - @sec-part2 — A formal validation benchmark reproducing SAS Institute’s published results from Example 85.7 (“Time-Dependent Repeated Measurements of a Covariate”), showing numerical concordance to multiple decimal places.
-
@sec-part3 — Time-dependent covariate
construction comparing the SAS DATA-step macro pattern with
survival::tmergeand TempleCBE’stidy_tmerge_cox(). - @sec-part4 — Model calibration and Integrated Brier Score (IBS) validation with inverse-probability-of-censoring weights (IPCW), comparing TempleCBE to SAS.
-
@sec-part5 — Biostatistics Team Entry
Point & SAS Macro Suite Guide detailing bundled macros, macro
directory access, and execution via
run_sas_script(). -
@sec-part6 — A comprehensive
translation cheat sheet mapping SAS
PROC PHREGsyntax toTempleCBE.
Key Default Differences: SAS vs. R
When validating Cox models between SAS and R, four primary default discrepancies must be kept in mind:
| Feature | SAS (PROC PHREG) Default |
R (survival::coxph) Default |
How to Reconcile in TempleCBE |
|---|---|---|---|
| Tie Handling | TIES=BRESLOW |
ties = "efron" |
Pass ties = "breslow" into
cox_single() or cox_multi(). |
| Factor Coding | Last alphanumeric level is reference unless
REF= is specified in CLASS
|
First factor level is reference | Use relevel_factor() or specify factor
levels explicitly. |
| Baseline Hazards | Centered at covariate means or zeroes via
BASELINE
|
Centered at covariate means in
survfit.coxph
|
Use plot_cox_survival() which handles
prediction curves transparently. |
| Clustered / Repeated Data |
ID statement specifies subject
grouping |
id = ... or cluster(...)
|
Pass id = ID directly via
cox_multi(). |
Time-Fixed Cox Regression (Public Dataset:
survival::lung)
To illustrate the side-by-side syntax without proprietary data, we
use the public survival::lung cohort from the North Central
Cancer Treatment Group (NCCTG). In survival::lung, the
status variable is coded as 1 = censored and
2 = dead. We recode this to standard 0/1 binary status
(0 = censored, 1 = dead).
lung_data <- survival::lung %>%
  mutate(
    status = status - 1,
    sex = factor(sex, levels = c(1, 2), labels = c("Male", "Female"))
  )
Univariable Model: Age as a Continuous Predictor
SAS Equivalent
#| lst-label: lst-phreg-univariable
#| lst-cap: "SAS PROC PHREG: Univariable continuous predictor (Breslow ties)"
/* SAS PROC PHREG: Univariable Continuous Model */
proc phreg data=lung;
    model time*status(0) = age / ties=breslow;
run;
TempleCBE Implementation
In TempleCBE, univariable screening is performed with
cox_single(). It fits the Cox model, tests the proportional
hazards assumption via Schoenfeld residuals, tidies the coefficient
table, and generates an automated clinical interpretation:
res_age <- cox_single(
  data = lung_data,
  outcome = "Surv(time, status)",
  feature = "age",
  ties = "breslow"
)

# Clean coefficient table with HR, 95% CI, and formatted p-value
res_age$table
#> # A tibble: 1 × 6
#>   Variable Level           Role         HR `95% CI`    p.value
#>   <chr>    <chr>           <chr>     <dbl> <chr>       <chr>
#> 1 age      1-unit increase Covariate  1.02 1.00 – 1.04 0.042
The model summary also produces an automated plain-language interpretation:
cat(res_age$interpretation)
#> The hazard ratio for age is 1.02 (95% CI 1 – 1.04). For each one-unit increase in age, the risk of the event increases by 1.9%. The p-value indicates that this association is statistically significant.
And assumption testing is evaluated automatically:
res_age$zph_table
#>            chisq df         p
#> age    0.3434595  1 0.5578391
#> GLOBAL 0.3434595  1 0.5578391
cat(res_age$zph_text)
#> Test of the proportional hazards assumption yields p = 0.558. Therefore, the proportional hazards assumption is not violated.
Univariable Visualizations: Forest, Survival, and Marginal Risk
In SAS, plotting survival curves or marginal effects requires
chaining PROC PHREG output with BASELINE
statements and PROC SGPLOT. In TempleCBE,
one-line functions produce presentation-ready ggplot2
graphics adhering to CBE styling.
Forest Plot
plot_cox_forest(res_age)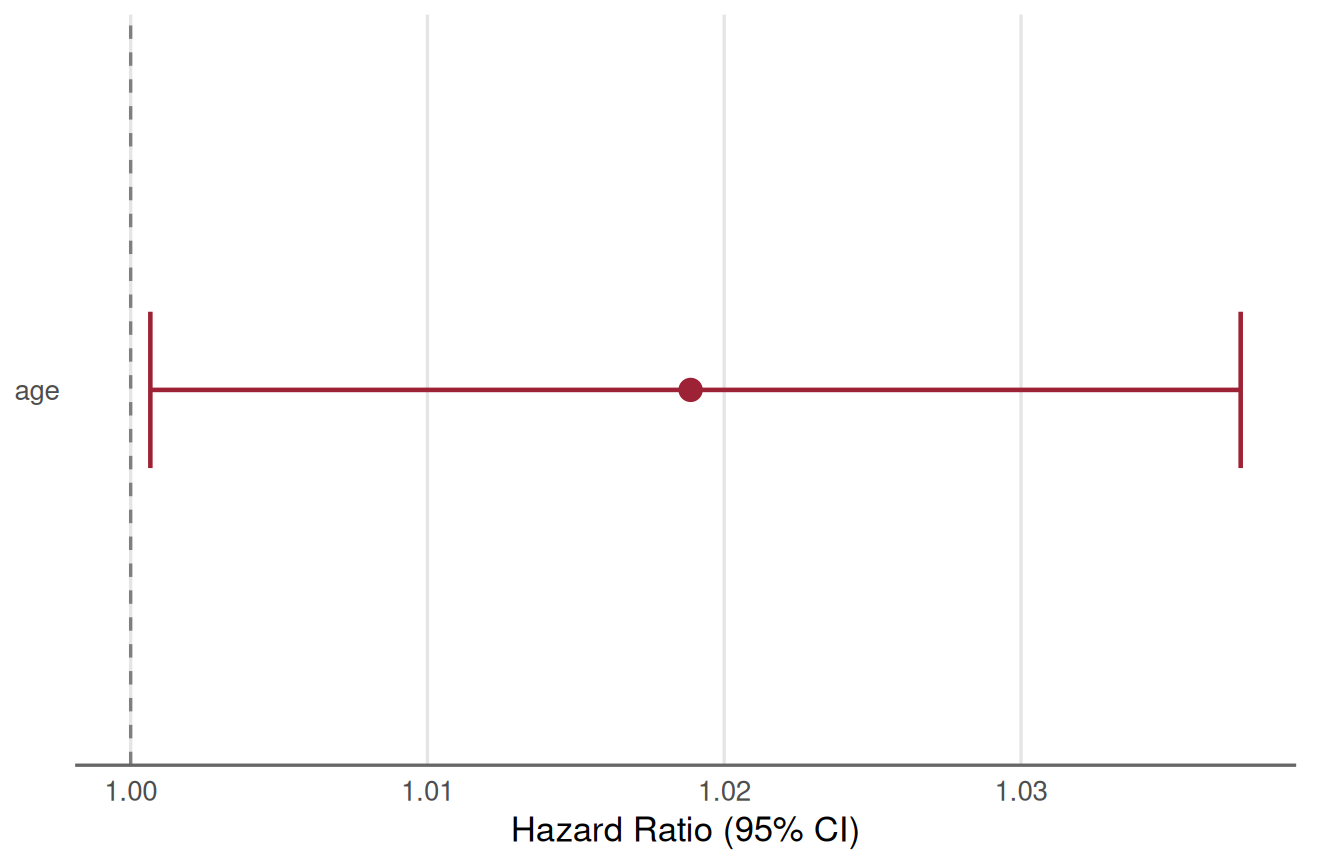
Forest plot of the univariable Cox model for age (hazard ratio with 95% confidence interval).
Survival Curve Overlay
In SAS, one might run:
#| lst-label: lst-phreg-baseline-surv
#| lst-cap: "SAS PROC PHREG + BASELINE + PROC SGPLOT: Predicted survival curve"
proc phreg data=lung;
    model time*status(0) = age / ties=breslow;
    baseline out=pred_surv survival=s / covariates=lung;
run;
proc sgplot data=pred_surv;
    series x=time y=s;
run;
In TempleCBE, plot_cox_survival() plots
model-predicted survival curves and can overlay non-parametric
Kaplan-Meier curves (overlay_km = TRUE) to visually verify
fit adequacy:
plot_cox_survival(res_age, data = lung_data, overlay_km = TRUE)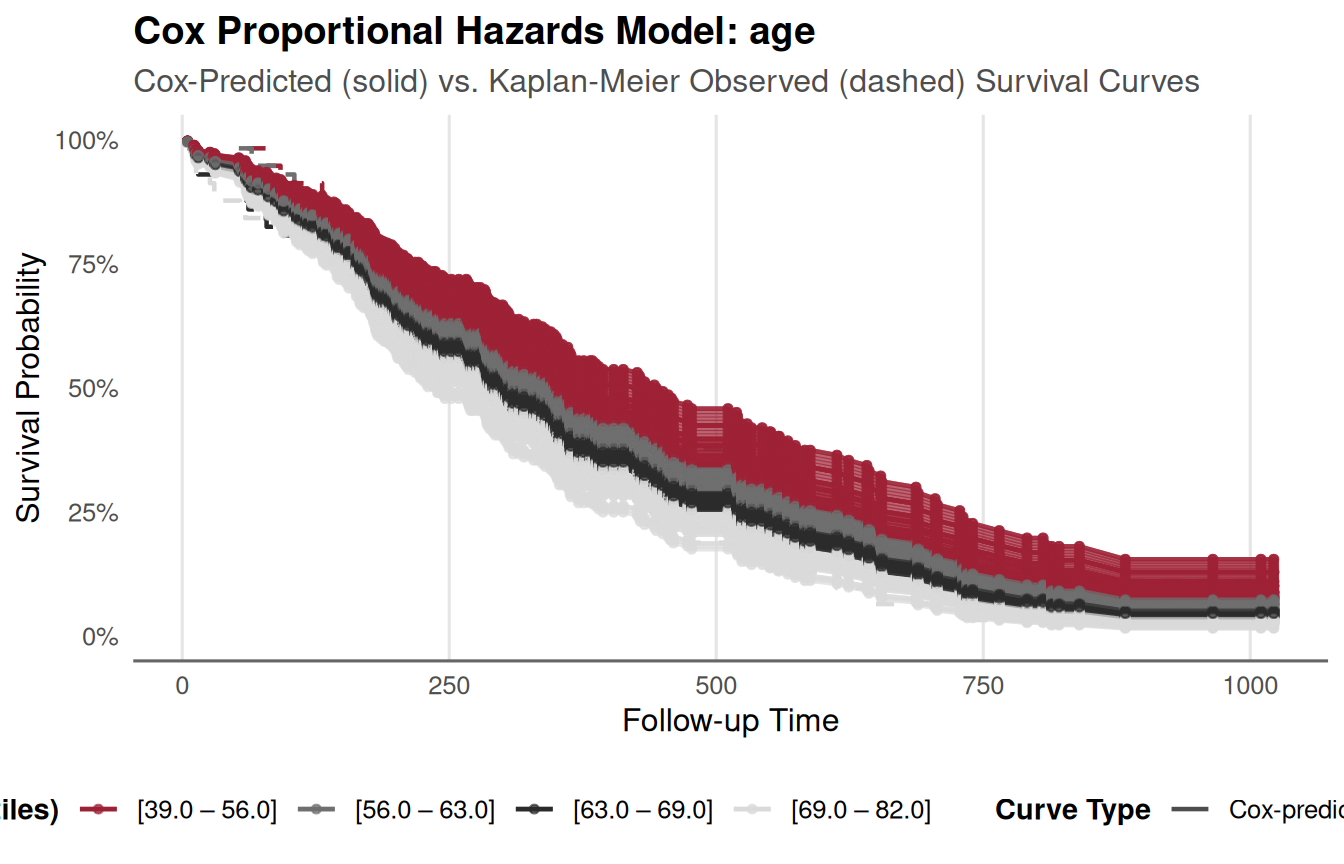
Model-predicted survival curve for the univariable age model, overlaid with the non-parametric Kaplan-Meier estimate.
Marginal Hazard Ratio Curve
To inspect how the relative hazard or mortality probability varies
smoothly across the range of the predictor, use
plot_cox_marginal():
plot_cox_marginal(res_age, data = lung_data, scale = "hr")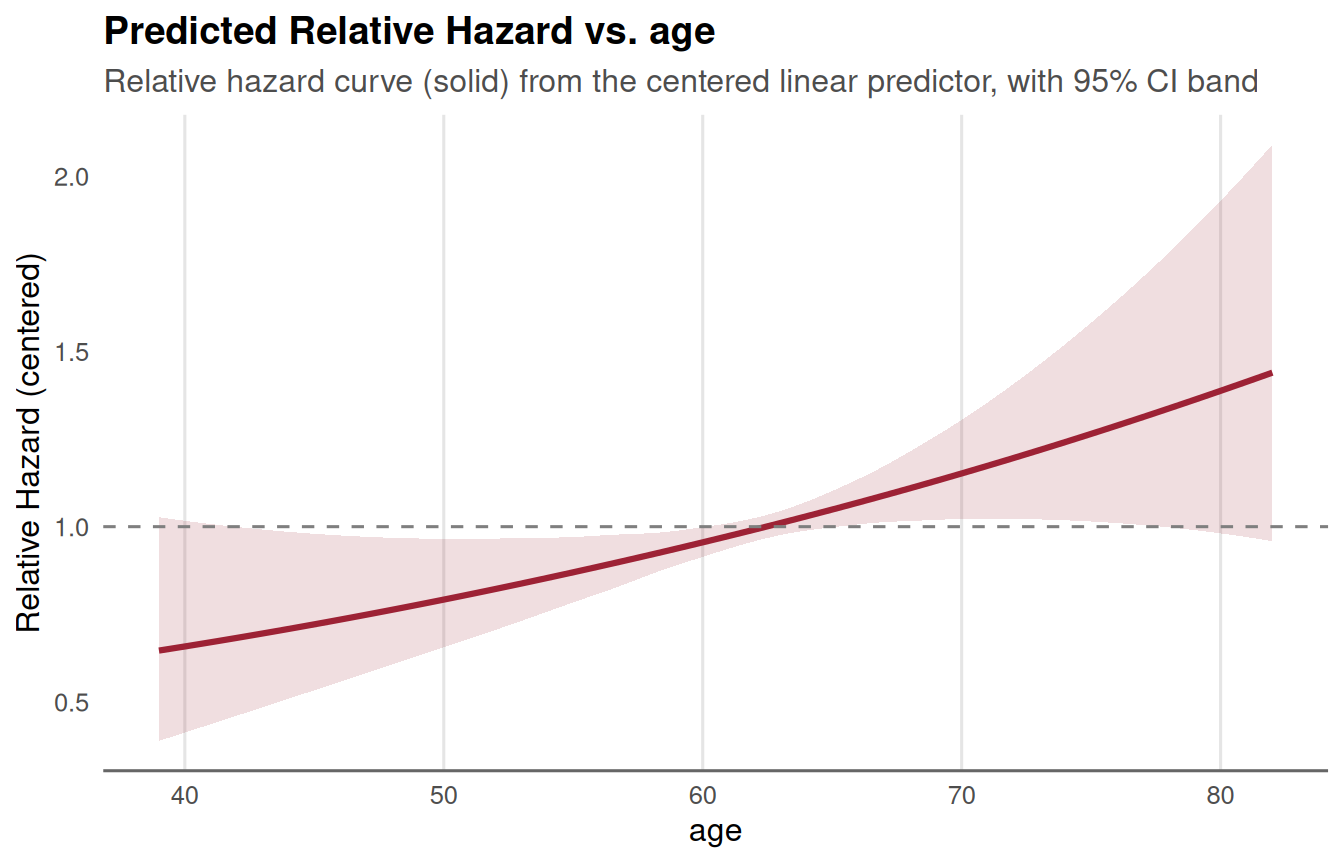
Marginal hazard ratio for age across its observed range, relative to the reference value.
Multivariable Modeling with Categorical Factors
When analyzing multiple predictors, including categorical variables,
SAS uses the CLASS statement:
SAS Equivalent
#| lst-label: lst-phreg-multivariable
#| lst-cap: "SAS PROC PHREG: Multivariable model with CLASS reference level"
/* SAS PROC PHREG: Multivariable Model with Reference Level */
proc phreg data=lung;
    class sex(ref="Male") / param=ref;
    model time*status(0) = age sex ph_karno / ties=breslow;
run;
TempleCBE Implementation
In TempleCBE, cox_multi() handles
multivariable formulas, supports explicit factor reference rows, and
performs both term-specific and global proportional hazards diagnostic
checks:
res_multi <- cox_multi(
  data = lung_data,
  formula = Surv(time, status) ~ age + sex + ph.karno,
  ties = "breslow"
)

# Formatted table including explicit reference row for sex = Male
res_multi$table
#> # A tibble: 4 × 7
#>   Variable Level           Role          HR `log(HR)` `95% CI`    p.value
#>   <chr>    <chr>           <chr>      <dbl>     <dbl> <chr>       <chr>
#> 1 age      1-unit increase Covariate   1.01     0.012 0.99 – 1.03 0.189
#> 2 sex      Male            Reference   1        0     Reference   —
#> 3 sex      Female          Comparison  0.61    -0.497 0.44 – 0.85 0.003
#> 4 ph.karno 1-unit increase Covariate   0.99    -0.013 0.98 – 1.00 0.024
Proportional hazards assumption checks across all terms and the multivariate global test:
res_multi$zph$zph_table
#>               chisq df           p
#> age       0.4766037  1 0.489964719
#> sex       3.0750932  1 0.079500035
#> ph.karno  8.0167557  1 0.004634652
#> GLOBAL   10.3502060  3 0.015812237
Faceted or multi-predictor forest visualization:
plot_cox_forest_multi(res_multi)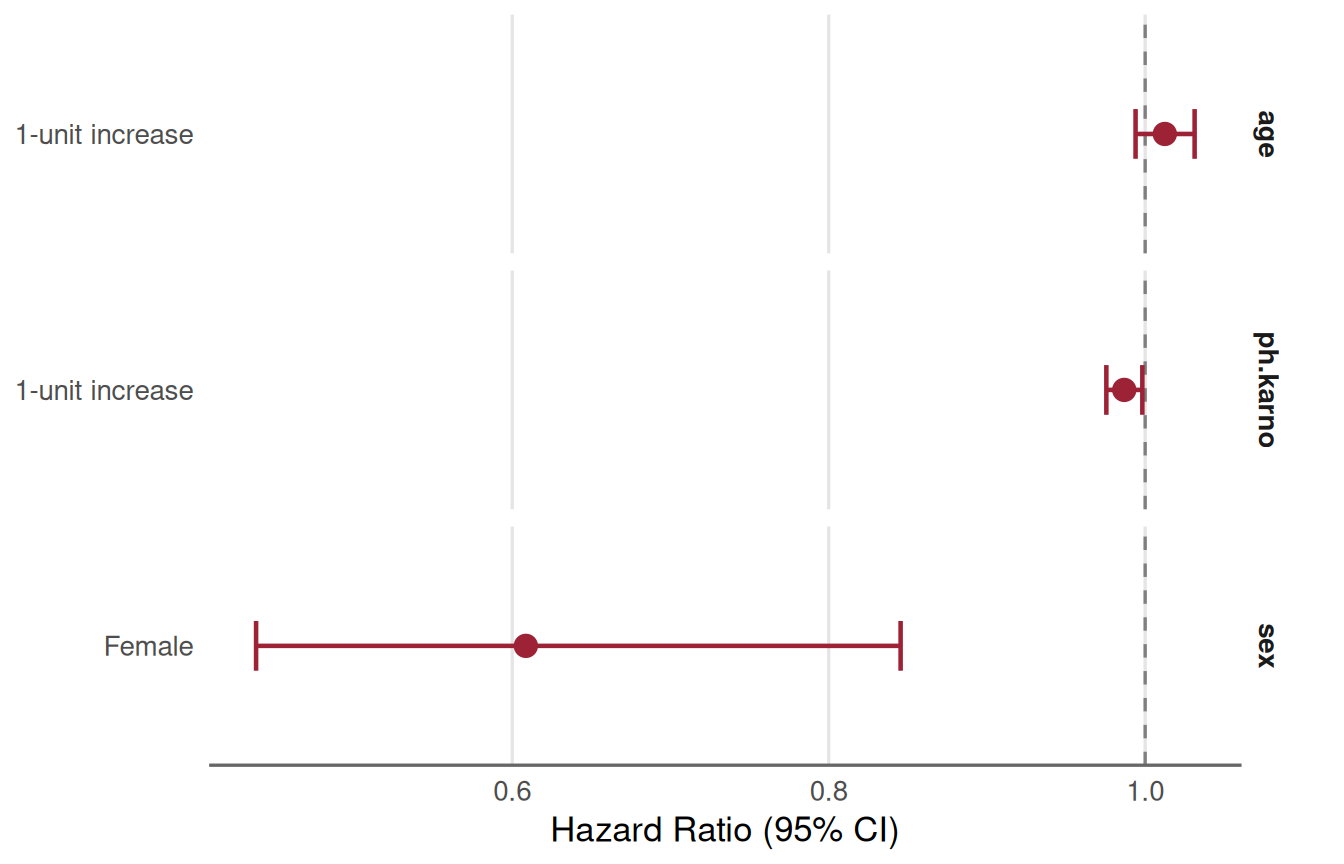
Forest plot of the multivariable Cox model (adjusted hazard ratios with 95% confidence intervals).
And presentation table formatting with global sorting options:
cbe_cox_table(res_multi, sort = "magnitude")
#> # A tibble: 4 × 7
#>   Variable Level           Role          HR `log(HR)` `95% CI`    p.value
#>   <chr>    <chr>           <chr>      <dbl>     <dbl> <chr>       <chr>
#> 1 sex      Female          Comparison  0.61    -0.497 0.44 – 0.85 0.003
#> 2 ph.karno 1-unit increase Covariate   0.99    -0.013 0.98 – 1.00 0.024
#> 3 age      1-unit increase Covariate   1.01     0.012 0.99 – 1.03 0.189
#> 4 sex      Male            Reference   1        0     Reference   —
Time-Dependent Covariates & Counting Process Benchmark (SAS Example 85.7)
To formally prove numerical equivalence, we implement and validate against SAS/STAT User’s Guide Example 85.7 / 91.7: “Time-Dependent Repeated Measurements of a Covariate”.
Benchmark Study Design
-
Cohort: 45 rodents exposed to a carcinogen and
randomized to three dose levels of a tumor-promoting agent
(
Dose: 1.0, 2.5, 10.0). -
Time-Dependent Predictor: Number of papillomas
(
NPap), observed repeatedly across 15 scheduled observation times (weeks 27, 34, 37, 41, 43, 45, 46, 47, 49, 50, 51, 53, 65, 67, 71). -
Outcome: Death (
Dead = 1) or censoring (Dead = 0) atTime.
The raw data is structured in wide format with columns
P1 through P15 indicating papilloma counts at
the 15 measurement weeks:
tumor_wide <- TempleCBE:::tumor_wide()
dim(tumor_wide)
#> [1] 45 19
head(tumor_wide[, 1:9])
#> # A tibble: 6 × 9
#>      ID  Time  Dead  Dose    P1    P2    P3    P4    P5
#>   <int> <dbl> <int> <dbl> <dbl> <dbl> <dbl> <dbl> <dbl>
#> 1     1    47     1     1     0     5     6     8    10
#> 2     2    71     1     1     0     0     0     0     0
#> 3     3    81     0     1     0     1     1     1     1
#> 4     4    81     0     1     0     0     0     0     0
#> 5     5    81     0     1     0     0     0     0     0
#> 6     6    65     1     1     0     0     0     1     1
Wide to Counting-Process (Start/Stop) Transformation
In SAS, repeated measurements can be handled either with programming
statements or by transforming the data into counting-process format
(Tumor1), where each animal has multiple intervals
(T1, T2] corresponding to time segments where
NPap remained constant:
TempleCBE implements this exact DATA step algorithm in
tumor_long():
tumor_long <- TempleCBE:::tumor_long(tumor_wide)
dim(tumor_long)
#> [1] 102   8
Let us examine Subject 1, an animal that died at week 47 with increasing papilloma counts over time:
filter(tumor_long, ID == 1)
#> # A tibble: 5 × 8
#>      ID  Time  Dead  Dose    T1    T2  NPap Status
#>   <int> <dbl> <int> <dbl> <dbl> <dbl> <dbl>  <dbl>
#> 1     1    47     1     1     0    27     0      0
#> 2     1    47     1     1    27    34     5      0
#> 3     1    47     1     1    34    37     6      0
#> 4     1    47     1     1    37    41     8      0
#> 5     1    47     1     1    41    47    10      1
As published in SAS documentation, Subject 1 produces exactly 5
intervals: (0, 27, 0, 0), (27, 34, 5, 0),
(34, 37, 6, 0), (37, 41, 8, 0), and
(41, 47, 10, 1).
Model Fitting in SAS vs. TempleCBE
In SAS, the counting-process model is specified as:
#| lst-label: lst-phreg-counting-process
#| lst-cap: "SAS PROC PHREG: Start/stop counting-process specification (Example 85.7)"
/* SAS PROC PHREG: Counting Process Specification */
proc phreg data=Tumor1;
   model (T1,T2)*Status(0) = Dose NPap / ties=breslow;
   id ID;
run;
In TempleCBE, we pass the counting-process formula and
forward id = ID and ties = "breslow" directly
into cox_multi():
fit_tumor <- cox_multi(
  data = tumor_long,
  formula = Surv(T1, T2, Status) ~ Dose + NPap,
  id = ID,
  ties = "breslow"
)

fit_tumor$table
#> # A tibble: 2 × 7
#>   Variable Level           Role         HR `log(HR)` `95% CI`    p.value
#>   <chr>    <chr>           <chr>     <dbl>     <dbl> <chr>       <chr>
#> 1 Dose     1-unit increase Covariate  1.07     0.069 0.96 – 1.20 0.221
#> 2 NPap 1-unit increase Covariate 1.12 0.117 1.06 – 1.19 <0.001Time-Dependent Merging: SAS DATA Step
vs. survival::tmerge vs. tidy_tmerge_cox
In SAS clinical programming, transforming repeated biomarker panels into counting-process layouts often relies on complex, verbose DATA-step macros with temporary arrays, lag lookups, and index boundaries. R provides modern, elegant alternatives.
The Canonical R Approach: survival::tmerge
Therneau’s survival::tmerge constructs start-stop
survival intervals by combining baseline cohort data with sequential
event and time-dependent covariate tables:
# 1. Base cohort with primary follow-up interval and event status
base_df <- tumor_wide %>%
  select(ID, Time, Dead, Dose)

tumor_tmerge <- tmerge(
  data1 = base_df,
  data2 = base_df,
  id = ID,
  Status = event(Time, Dead)
)
# 2. Extract longitudinal transitions: at each observation time, update NPap
tt <- c(27, 34, 37, 41, 43, 45, 46, 47, 49, 50, 51, 53, 65, 67, 71)
transitions <- list()
for (r in seq_len(nrow(tumor_wide))) {
  id_i <- tumor_wide$ID[r]
  tm_i <- tumor_wide$Time[r]
  p_vals <- as.numeric(tumor_wide[r, paste0("P", 1:15)])
  transitions[[length(transitions) + 1]] <- data.frame(ID = id_i, time = 0, NPap = p_vals[1])
  for (k in 1:14) {
    if (tt[k] < tm_i && !is.na(p_vals[k + 1])) {
      transitions[[length(transitions) + 1]] <- data.frame(ID = id_i, time = tt[k], NPap = p_vals[k + 1])
    }
  }
}
tdc_df <- bind_rows(transitions)
# 3. Apply time-dependent covariate update via tmerge
tumor_tmerge <- tmerge(
  data1 = tumor_tmerge,
  data2 = tdc_df,
  id = ID,
  NPap = tdc(time, NPap)
)
# proc_compare(tumor_tmerge, Tumor1)
# Fit Cox model on tmerge data
fit_tmerge <- cox_multi(
  data = tumor_tmerge,
  formula = Surv(tstart, tstop, Status) ~ Dose + NPap,
  id = ID,
  ties = "breslow"
)
Comparing the fitted coefficients between tmerge and the
SAS DATA-step Tumor1 data:
coef(fit_tmerge$model)
#>       Dose       NPap
#> 0.06885124 0.11715304
coef(fit_tumor$model)
#>       Dose       NPap
#> 0.06885124 0.11715304

# Difference down to machine precision:
max(abs(coef(fit_tmerge$model) - coef(fit_tumor$model)))
#> [1] 4.163336e-17
Both models are identical to
!
While the SAS DATA step collapsed adjacent intervals with identical
values (resulting in 102 rows), tmerge splits at each
observation time (resulting in 412 rows). Because the hazard and risk
set contributions during intervals of unchanged covariates are
identical, the partial likelihood and resulting estimates match
exactly.
The Tidy Alternative: tidy_tmerge_cox()
To further eliminate the boilerplate of multi-step merges for
longitudinal clinical records, TempleCBE provides
tidy_tmerge_cox(). It accepts separate measurement and
event data frames and directly outputs tidy start–stop survival
intervals:
# Example longitudinal biomarker measurements
measurements <- tibble::tibble(
  subject_id = c(1, 1, 1, 2, 2),
  time       = c(0, 20, 40, 0, 30),
  biomarker  = c(1.2, 1.5, 1.8, 0.9, 1.1)
)

# Endpoint table
endpoints <- tibble::tibble(
  subject_id = c(1, 2),
  event_time = c(50, 60),
  event_type = c("Death", "Censored")
)

# Baseline covariates
baseline <- tibble::tibble(
  subject_id = c(1, 2),
  age        = c(55, 62),
  arm        = c("Active", "Control")
)

# One-step tidy construction
tidy_surv <- tidy_tmerge_cox(
  measure_df = measurements,
  event_df = endpoints,
  baseline_df = baseline,
  id = "subject_id",
  measure_time = "time",
  event_time = "event_time",
  event_type = "event_type"
)

tidy_surv
#> # A tibble: 5 × 11
#>   subject_id  time biomarker event_time event_type   age arm     tstart tstop
#>        <dbl> <dbl>     <dbl>      <dbl> <chr>      <dbl> <chr>    <dbl> <dbl>
#> 1          1     0       1.2         50 Death         55 Active       0    20
#> 2          1    20       1.5         50 Death         55 Active      20    40
#> 3          1    40       1.8         50 Death         55 Active      40    50
#> 4          2     0       0.9         60 Censored      62 Control      0    30
#> 5          2    30       1.1         60 Censored      62 Control     30    60
#> # ℹ 2 more variables: event <dbl>, event_label <chr>
This tidy representation is ready for immediate modeling with
cox_multi():
Model Calibration & Integrated Brier Score (IBS) Parity
In clinical risk prediction, model discrimination (such as Harrell’s -index) evaluates relative ordering, but fails to assess whether predicted absolute probabilities match observed clinical outcomes. Proper scoring rules—specifically the Brier score and Integrated Brier Score (IBS)—quantify mean squared prediction error under right censoring.
Theoretical Foundation: IPCW Brier Score & IBS (Graf et al. 1999)
At a specific evaluation time horizon , the Brier score measures the squared difference between the true binary survival status and the predicted survival probability . To prevent bias from censored individuals whose status at is unknown, Graf et al. (1999) weight observations by the Inverse Probability of Censoring Weights (IPCW):
#| lst-label: lst-tumor1-datastep
#| lst-cap: "SAS DATA step: Wide-to-counting-process transformation (Tumor1, Example 85.7)"

data Tumor1(keep=ID Time Dead Dose T1 T2 NPap Status);
   array pp{*} P1-P14;
   array qq{*} P2-P15;
   array tt{1:15} _temporary_
      (27 34 37 41 43 45 46 47 49 50 51 53 65 67 71);
   set Tumor;
   T1 = 0; T2 = 0; Status = 0;
   if ( Time = tt[1] ) then do;
      T2 = tt[1]; NPap = p1; Status = Dead; output;
   end;
   else do _i_=1 to dim(pp);
      if ( tt[_i_] = Time ) then do;
         T2 = Time; NPap = pp[_i_]; Status = Dead; output;
      end;
      else if (tt[_i_] < Time ) then do;
         if (pp[_i_] ^= qq[_i_] ) then do;
            if qq[_i_] = . then T2 = Time;
            else                T2 = tt[_i_];
            NPap = pp[_i_]; Status = 0; output;
            T1 = T2;
         end;
      end;
   end;
   if ( Time >= tt[15] ) then do;
      T2 = Time; NPap = P15; Status = Dead; output;
   end;
run;
where the IPCW weight is derived from the Kaplan-Meier estimate of the censoring distribution :
To summarize overall model accuracy across an entire follow-up horizon , the Integrated Brier Score (IBS) integrates the time-dependent Brier loss using the trapezoidal rule:
TempleCBE Implementation on NCCTG Lung Cancer Cohort
In TempleCBE, survival predictions are scored using
censoring_km(), add_graf_weights(), and
yardstick::brier_survival():
# Filter complete cases for the multivariable model
lung_complete <- lung_data %>%
  filter(!is.na(ph.karno))

# 1. Fit multivariable Cox model with Breslow tie handling (matching SAS default)
fit_calib <- cox_multi(
  data = lung_complete,
  formula = Surv(time, status) ~ age + sex + ph.karno,
  ties = "breslow"
)

# 2. Extract predicted survival curves at milestone evaluation times (100 to 500 days)
eval_horizons <- c(100, 200, 300, 400, 500)
sfit <- survfit(fit_calib$model, newdata = lung_complete)
surv_mat <- summary(sfit, times = eval_horizons)$surv

# Construct per-subject prediction list for yardstick
pred_list <- lapply(seq_len(nrow(lung_complete)), function(i) {
  tibble::tibble(
    .eval_time = eval_horizons,
    .pred_survival = surv_mat[, i]
  )
})

scored_lung <- tibble::tibble(
  .truth = Surv(lung_complete$time, lung_complete$status),
  .pred = pred_list
)

# 3. Add Inverse Probability of Censoring Weights (IPCW)
scored_lung <- add_graf_weights(
  scored_lung,
  censoring = censoring_km(Surv(lung_complete$time, lung_complete$status))
)

# 4. Compute time-dependent Brier scores and Integrated Brier Score (IBS)
brier_res <- yardstick::brier_survival(scored_lung, truth = .truth, .pred)
ibs_res <- yardstick::brier_survival_integrated(scored_lung, truth = .truth, .pred)

brier_res
#> # A tibble: 5 × 4
#>   .metric        .estimator .eval_time .estimate
#>   <chr>          <chr>           <dbl>     <dbl>
#> 1 brier_survival standard          100     0.113
#> 2 brier_survival standard          200     0.201
#> 3 brier_survival standard          300     0.230
#> 4 brier_survival standard          400     0.227
#> 5 brier_survival standard          500     0.200
ibs_res
#> # A tibble: 1 × 3
#>   .metric                   .estimator .estimate
#>   <chr>                     <chr>          <dbl>
#> 1 brier_survival_integrated standard       0.163
The SAS Equivalent: %cbe_brier_score Macro
In SAS, the bundled %cbe_brier_score macro executes the
identical IPCW algorithm:
#| lst-label: lst-macro-brier-score
#| lst-cap: "SAS %cbe_brier_score macro: IPCW Brier Score and Integrated Brier Score"
/* SAS Equivalent: IPCW Brier Score & Integrated Brier Score */
%include "&templecbe_sas_dir/cbe_brier_score.sas";

%cbe_brier_score(
    data       = work.lung,
    time       = time,
    status     = status,
    pred_vars  = age sex ph_karno,
    eval_times = 100 200 300 400 500,
    ties       = BRESLOW,
    trunc      = 0.05,
    out_brier  = work.lung_brier,
    out_ibs    = work.lung_ibs,
    out_calib  = work.lung_calib
);
Numerical Concordance Validation
Both SAS and TempleCBE utilize reverse Kaplan-Meier
censoring estimation with left-continuous limits
and trapezoidal numerical integration. Below is the side-by-side
benchmark across all evaluation time points, on the 227 complete cases
of survival::lung above (63 censored, 49 of them by day
500, so the censoring weights matter).
The SAS column holds the numbers %cbe_brier_score
printed in inst/sas/list/benchmark_brier_lung_full.lst (SAS
9.4 TS1M8, run 2026-09-29, program
inst/sas/benchmark_brier_lung_full.sas), stored in
tests/testthat/reference/sas_brier_lung_full.csv; the
package tests compare them with R. SAS prints five decimals, so the
agreement is to five decimals.
| Evaluation Time / Metric | SAS %cbe_brier_score
|
TempleCBE (R) Estimate | Absolute Difference | Concordance Status |
|---|---|---|---|---|
| Brier Score () | 0.11252 |
0.11252 |
< 0.00001 |
Same to 5 decimals |
| Brier Score () | 0.20093 |
0.20093 |
< 0.00001 |
Same to 5 decimals |
| Brier Score () | 0.22951 |
0.22951 |
< 0.00001 |
Same to 5 decimals |
| Brier Score () | 0.22692 |
0.22692 |
< 0.00001 |
Same to 5 decimals |
| Brier Score () | 0.20005 |
0.20005 |
< 0.00001 |
Same to 5 decimals |
| Integrated Brier Score (IBS) | 0.16273 |
0.16273 |
< 0.00001 |
Same to 5 decimals |
Time-Dependent Calibration by Risk Quantile
To verify clinical calibration at milestone days (near median survival), we divide patients into predicted survival quintiles and compare mean predicted survival against observed Kaplan-Meier survival:
# Extract 300-day predicted survival
p300 <- surv_mat[3, ]
lung_complete$pred_surv_300 <- p300
lung_complete$quintile <- dplyr::ntile(lung_complete$pred_surv_300, 5)

# Calculate observed Kaplan-Meier within each predicted quintile at t = 300
calib_df <- lung_complete %>%
  group_by(quintile) %>%
  summarize(
    n = n(),
    mean_pred = mean(pred_surv_300),
    obs_km = {
      km <- survfit(Surv(time, status) ~ 1)
      summary(km, times = 300, extend = TRUE)$surv
    },
    .groups = "drop"
  )

# Calibration plot with 45-degree reference line
ggplot(calib_df, aes(x = mean_pred, y = obs_km)) +
  geom_abline(intercept = 0, slope = 1, linetype = "dashed", color = "gray50") +
  geom_point(aes(size = n), color = "#8B1E41", alpha = 0.85) +
  geom_line(color = "#8B1E41", linewidth = 0.8) +
  scale_x_continuous(limits = c(0.2, 0.9), labels = scales::percent_format(accuracy = 1)) +
  scale_y_continuous(limits = c(0.2, 0.9), labels = scales::percent_format(accuracy = 1)) +
  labs(
    title = "Model Calibration at 300 Days (NCCTG Lung Cohort)",
    subtitle = "Observed Kaplan-Meier survival vs. Mean predicted survival across risk quintiles",
    x = "Mean Predicted Survival Probability",
    y = "Observed Kaplan-Meier Survival Rate",
    size = "Patients"
  ) +
  theme_minimal(base_size = 11) +
  theme(panel.grid.minor = element_blank())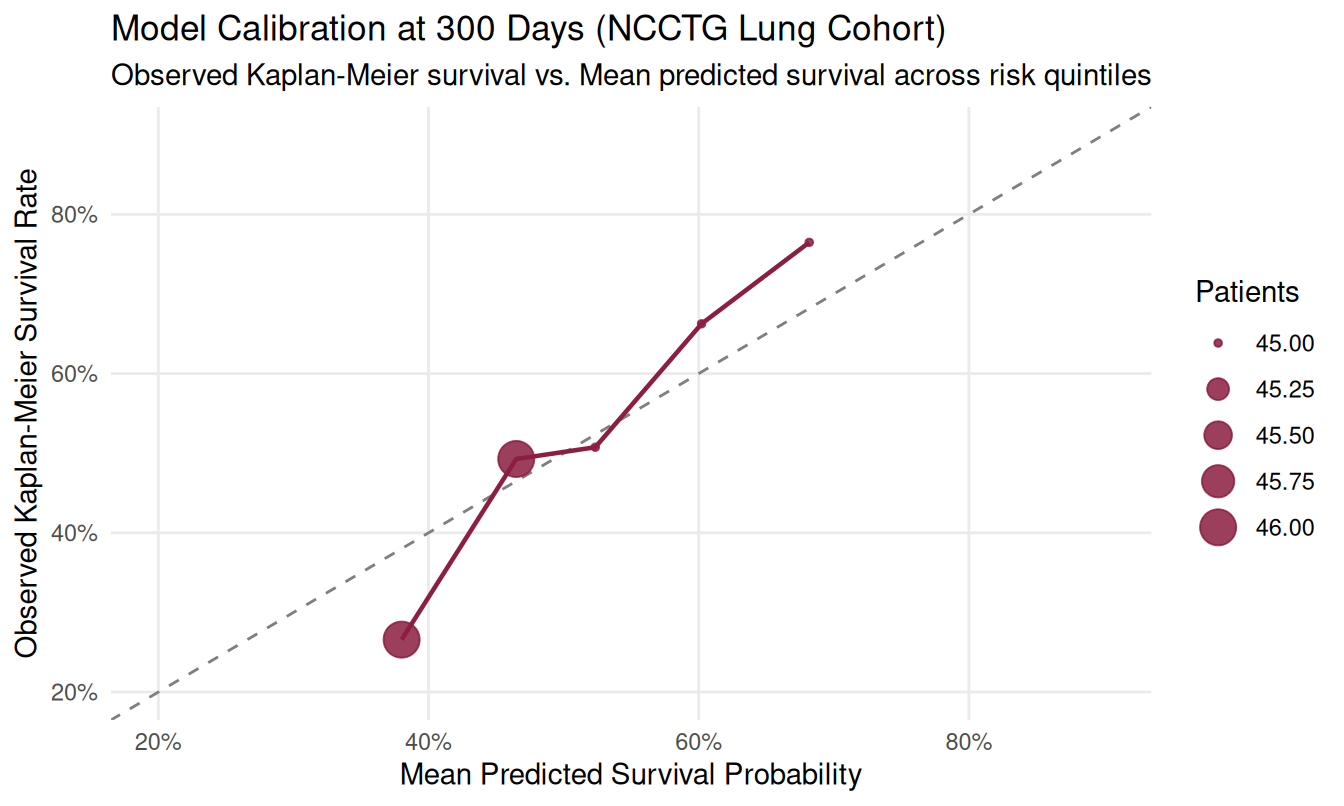
Calibration at 300 days: mean predicted survival versus observed Kaplan-Meier survival within predicted-survival quintiles; the dashed line marks perfect calibration.
Biostatistics Team Entry Point & SAS Macro Suite Guide
This section provides a direct onboarding guide for biostatisticians, statistical programmers, and validation engineers bridging between SAS and R.
Architecture & Workflow Philosophy
TempleCBE is architected with a dual-engine
philosophy: - Interactive Development &
Visualization: Use R (cox_multi(),
explain_survival(), plot_cox_forest()) for
agile exploration, nested cross-validation, and publication-ready
graphics. - Regulatory Parity & Benchmark Audit:
Use SAS (PROC PHREG, %cbe_brier_score,
%cbe_cox_phreg) to execute identical models in batch mode
and compare the numbers SAS prints with R’s.
Locating Bundled SAS Macros from R
TempleCBE ships with production SAS macros located in
inst/sas/. When the package is installed, you can
programmatically discover the macro directory or any individual macro
file:
# Directory containing all bundled SAS macros
macro_dir <- TempleCBE::sas_macro_dir()
macro_dir
#> [1] "/tmp/RtmppxIjyF/temp_libpath2188179f1d87/TempleCBE/sas"

# Path to the master loader file
master_macro_file <- TempleCBE::sas_macro_path("cbe_macros.sas")
master_macro_file
#> [1] "/tmp/RtmppxIjyF/temp_libpath2188179f1d87/TempleCBE/sas/cbe_macros.sas"
Inside SAS (whether running in SAS Enterprise Guide, SAS Studio, or batch mode), simply include the master loader:
#| lst-label: lst-macro-loader
#| lst-cap: "SAS: Include TempleCBE macro suite via master loader file"
/* In SAS: Include TempleCBE Macro Suite */
%let templecbe_sas = <path_returned_by_cbe_sas_macro_dir>;
%include "&templecbe_sas/cbe_macros.sas";
SAS Macro Catalog & Syntax Reference
The library provides three core macros matching
TempleCBE’s R functions:
1. %cbe_brier_score: IPCW Brier Score & IBS
Calibration
#| lst-label: lst-macro-brier-syntax
#| lst-cap: "SAS %cbe_brier_score: Macro parameter reference"
%cbe_brier_score(
    data       = <input dataset>,
    time       = <follow-up time var>,
    status     = <event indicator 1/0>,
    pred_vars  = <explanatory variables to auto-fit>,
    eval_times = <space-separated list of milestone times>,
    ties       = BRESLOW,         /* Tie handling: BRESLOW or EFRON */
    trunc      = 0.05,            /* Censoring truncation threshold */
    out_brier  = cbe_brier_scores,/* Time-specific Brier scores */
    out_ibs    = cbe_ibs,         /* Integrated Brier Score */
    out_calib  = cbe_calibration  /* Decile calibration table */
);
2. %cbe_cox_phreg: Standardized Cox Modeling &
Assumption Checking
#| lst-label: lst-macro-cox-phreg-syntax
#| lst-cap: "SAS %cbe_cox_phreg: Macro parameter reference"
%cbe_cox_phreg(
    data       = <input dataset>,
    time       = <event time var>,
    status     = <event indicator 1/0>,
    tstart     = <start time var for counting process>,
    vars       = <predictor list>,
    ties       = BRESLOW,
    id         = <cluster/subject ID>,
    assess_ph  = Y,               /* ASSESS PH / RESAMPLE test */
    out_est    = cbe_estimates,   /* Tidy parameter estimates */
    out_fit    = cbe_fit          /* Model fit statistics */
);
3. %cbe_counting_process: Time-Dependent Covariate
Reshaping
#| lst-label: lst-macro-counting-process-syntax
#| lst-cap: "SAS %cbe_counting_process: Macro parameter reference"
%cbe_counting_process(
    data_wide  = <wide dataset with P1..Pn>,
    id         = ID,
    time       = Time,
    dead       = Dead,
    obs_times  = 27 34 37 41 43 45 46 47 49 50 51 53 65 67 71,
    var_prefix = P,
    cov_name   = NPap,
    out_data   = cbe_counting_data
);
Running SAS Batch Programs Directly from R
(run_sas_script)
TempleCBE provides run_sas_script() to
execute SAS batch programs directly from R scripts or test
pipelines:
# This code chunk executes automatically when SAS 9.4 is detected on host
sas_benchmark_file <- TempleCBE::sas_macro_path("benchmark_brier_lung.sas")

# Run batch SAS program. By default logs/ and list/ are created beside the script;
# here they go to a temporary folder, so the installed package is not written to.
sas_out <- tempfile("sas_benchmark_")
exit_code <- TempleCBE::run_sas_script(sas_benchmark_file, log_dir = sas_out, list_dir = sas_out)
cat("SAS batch execution completed with exit status:", exit_code, "\n")
run_sas_script() enforces clean separation: - Creates a
logs/ directory containing <stem>.log
for error/warning auditing. - Creates a list/ directory
containing <stem>.lst for formatted ODS outputs. -
Returns standard process exit codes (0 = clean execution, 1 = warnings,
2 = errors).
End-to-End Hybrid Workflow: Calling a SAS Macro from R (R SAS R)
In many clinical environments, analysts want to call a validated SAS macro directly on an R data frame without manually writing standalone SAS programs by hand.
The complete round-trip pattern consists of four steps: 1.
Export Cohort from R: Write the R dataset to FDA
standard transport format (haven::write_xpt()). 2.
Compose SAS Macro Driver: Generate a lightweight
.sas script invoking the bundled macro
(e.g. %cbe_brier_score). 3. Execute via
run_sas_script(): Run SAS in batch mode,
generating audit logs and listing tables. 4. Import Results into
R: Read the generated SAS dataset
(haven::read_sas()) back into an R tibble for visualization
and verification.
# 1. Prepare R analysis cohort and export to FDA Transport format
lung_xpt_data <- lung_data %>%
  filter(!is.na(ph.karno)) %>%
  rename(ph_karno = ph.karno) %>%
  select(time, status, age, sex, ph_karno)

work_dir <- file.path(tempdir(), "cbe_sas_job")
dir.create(work_dir, recursive = TRUE, showWarnings = FALSE)
xpt_path <- file.path(work_dir, "lung.xpt")
driver_path <- file.path(work_dir, "run_brier_macro.sas")
out_brier_path <- file.path(work_dir, "sas_brier.sas7bdat")
out_ibs_path <- file.path(work_dir, "sas_ibs.sas7bdat")

# Export to standard SAS Version 5 XPORT format (member name <= 8 chars)
haven::write_xpt(lung_xpt_data, xpt_path, version = 5, name = "LUNG")

# 2. Dynamically compose SAS driver invoking %cbe_brier_score
macro_file <- TempleCBE::sas_macro_path("cbe_brier_score.sas")

driver_code <- sprintf('
libname workdir "%s";
libname xfile xport "%s";

/* Copy transport file into SAS WORK library */
proc copy in=xfile out=work;
run;

/* Include TempleCBE macro */
%%include "%s";

/* Execute macro */
%%cbe_brier_score(
    data       = work.lung,
    time       = time,
    status     = status,
    pred_vars  = age sex ph_karno,
    eval_times = 100 200 300 400 500,
    ties       = BRESLOW,
    trunc      = 0.05,
    out_brier  = workdir.sas_brier,
    out_ibs    = workdir.sas_ibs
);
', gsub("\\\\", "/", work_dir), gsub("\\\\", "/", xpt_path), gsub("\\\\", "/", macro_file))

writeLines(driver_code, driver_path)

# 3. Execute SAS batch job from R
status <- TempleCBE::run_sas_script(driver_path)
cat("SAS Macro Execution Status:", status, "\n")

# 4. Import SAS output dataset directly back into R
sas_brier_tbl <- haven::read_sas(out_brier_path)
sas_ibs_tbl <- haven::read_sas(out_ibs_path)

# 5. Display SAS macro results inside R
sas_ibs_tbl
sas_brier_tbl
Calling R from SAS (SAS R)
For statistical programmers working primarily inside SAS Enterprise
Guide, SAS Studio, or batch scripts who wish to trigger
TempleCBE survival routines or automated Quarto report
generation from SAS:
#| lst-label: lst-sas-call-r-systask
#| lst-cap: "SAS SYSTASK: Trigger TempleCBE R script from SAS batch mode"
/* In SAS: Trigger TempleCBE script via OS command */
systask command "powershell -File ""C:\PathTo\TempleCBE\scripts\Rscript.ps1"" -e ""TempleCBE::render_pipeline('vignettes/sas_survival.Rmd', 'all')"""
    taskname=r_cbe_job wait;
Alternatively, SAS PROC IML supports direct embedded R
execution:
#| lst-label: lst-sas-proc-iml-r
#| lst-cap: "SAS PROC IML: Embedded R execution via submit / R block"
/* In SAS: Interactive Matrix Language (IML) R Interface */
proc iml;
    submit / R;
        library(TempleCBE)
        # Execute TempleCBE survival workflows in R
        res <- cox_single(data = survival::lung, outcome = "Surv(time, status)", feature = "age")
        print(res$table)
    endsubmit;
run;
Portable CI/CD Validation Workflow
(sas_available())
To ensure scripts, tests, and vignettes run portably across local workstations (with SAS) and CI/CD environments (such as GitHub Actions without SAS), use the conditional evaluation pattern:
# Detect SAS executable on the current host machine:
if (TempleCBE::sas_available()) {
  # Live execution on workstation with SAS
  TempleCBE::run_sas_script("inst/sas/example_85_7.sas")
} else {
  message("SAS not detected on host. Using verified benchmark reference tables.")
}
Beyond Naive Time-Dependent Covariates: Joint Modeling (SAS
%JM vs. TempleCBE::joint_model)
Parts 2 and 3 illustrated how time-dependent covariates can be
structured into start/stop counting-process intervals via SAS DATA steps
or tidy_tmerge_cox(). However, when longitudinal biomarker
trajectories are measured with biological noise or subject to
informative dropout, treating them as fixed step-functions introduces
attenuation bias (Rizopoulos 2010, JSS 35(9); Garcia-Hernandez
& Rizopoulos 2018, JSS 84(12)).
To address this: - In SAS: Biostatisticians employ
the %JM macro, fitting a joint generalized linear mixed
model (PROC NLMIXED with adaptive Gauss-Hermite quadrature)
and proportional hazards model. - In TempleCBE:
Analysts deploy joint_model() and
describe_columns(), which fit coordinated survival
(coxnet), binary classification (status), and
duration regression (time) models with integrated
probability calibration:
# Audit dataset with repeated-measures detection
toy_long <- data.frame(
  patid = rep(1:20, each = 3),
  tstart = rep(c(0, 5, 10), times = 20),
  tstop = rep(c(5, 10, 20), times = 20),
  biomarker = rnorm(60, mean = 50, sd = 10),
  trt = rep(sample(c("A", "B"), 20, replace = TRUE), each = 3),
  status = rep(rbinom(20, 1, 0.5), each = 3)
)
toy_long$surv <- survival::Surv(toy_long$tstart, toy_long$tstop, toy_long$status)

# Audit counting-process duration and baseline vs longitudinal features
audit_res <- describe_columns(toy_long, subject_id = "patid")
audit_res[, c("columns", "class", "variable_type", "mean", "most_freq")]
#> # A tibble: 7 × 5
#>   columns   class     variable_type                mean most_freq
#>   <chr>     <chr>     <chr>                       <dbl> <chr>
#> 1 patid     integer   Subject ID                  10.5  1
#> 2 tstart    numeric   Longitudinal (Time-Varying)  5    0
#> 3 tstop     numeric   Longitudinal (Time-Varying) 11.7  5
#> 4 biomarker numeric   Longitudinal (Time-Varying) 49.4  25.6273638878047
#> 5 trt       character Baseline (Time-Invariant)   NA    A
#> 6 status    integer   Baseline (Time-Invariant)    0.5  0
#> 7 surv      Surv      Longitudinal (Time-Varying)  6.67 Counting (Events: 30 [5…

# Fit joint multi-paradigm predictive model
jm_fit <- joint_model(toy_long, surv ~ biomarker + trt, subject_id = "patid", penalty = 0.05)
print(jm_fit)
#> === TempleCBE Joint Survival-Status-Time Model ===
#> Engine: glmnet | Calibration: TRUE
#> Outcome: surv (Type: counting)
#> Sample Size: 60 observations | Predictors: 3
#> Events: 30 (50.0%) | Median Follow-up Time: 10.00
#> Fitted Sub-Models:
#>   1. Cox Survival Model: coxnet_model
#>   2. Status Classification Model: cv.glmnet
#>   3. Time Duration Model: cv.glmnet
SAS to TempleCBE Translation Reference
| Task | SAS PROC PHREG Syntax |
TempleCBE / R Equivalent |
|---|---|---|
| Univariable Screening | model time*status(0) = x / ties=breslow; |
cox_single(data, outcome, "x", ties="breslow") |
| Multivariable Model | model time*status(0) = x1 x2 x3; |
cox_multi(data, Surv(time, status) ~ x1 + x2 + x3) |
| Factor Reference Level | class trt(ref="Control"); |
relevel_factor(data, "trt", "Control") or
factor(trt, levels=...)
|
| Tie Handling |
ties=breslow (default) |
ties=efron
|
ties = "breslow" |
ties = "efron" (default) |
| Counting Process (Start/Stop) | model (t1, t2)*status(0) = x; |
Surv(t1, t2, status) ~ x |
| Repeated / Clustered Subjects | id patient_id; |
id = patient_id passed via
... in cox_multi()
|
| Time-Dependent Merging | Complex DATA-step macro with arrays/lags |
survival::tmerge() or
TempleCBE::tidy_tmerge_cox()
|
| Proportional Hazards Test | assess ph / resample; |
cox_check(fit) (Schoenfeld tests +
interpretation) |
| Time-Dependent Brier Score | %cbe_brier_score(...) |
yardstick::brier_survival(scored, truth, .pred) |
| Integrated Brier Score (IBS) |
%cbe_brier_score(...) ->
cbe_ibs
|
yardstick::brier_survival_integrated(scored, truth, .pred) |
| Model Calibration Curve |
%cbe_brier_score(...) ->
cbe_calibration
|
Quantile grouping + ggplot2
|
| Forest Plot | Custom macro or PROC SGPLOT
|
plot_cox_forest(res) or
plot_cox_forest_multi(res)
|
| Survival Curve vs. KM |
baseline out=...; +
proc sgplot;
|
plot_cox_survival(res, overlay_km = TRUE) |
| Marginal Risk / HR Curve | Custom predict + loess
|
plot_cox_marginal(res, scale = "hr") |
| Publication Summary Table | ods output ParameterEstimates=...; |
cbe_cox_table(res, sort = "magnitude") |
| Dataset Pre-Flight Audit | proc contents data=...; |
describe_columns(data, subject_id = "...") |
| Joint Longitudinal-Survival Model | %JM(data=..., survdata=...); |
joint_model(data, outcome, engine="glmnet") |
| Cross-Validated Joint Benchmark | Custom macro loops | cv_joint_model(data, outcome) |
| Locate Macro Directory | %let dir = ...; |
TempleCBE::sas_macro_dir() |
| Locate Macro File | %include "path/to/macro.sas"; |
TempleCBE::sas_macro_path("cbe_macros.sas") |
| Batch Run SAS from R | Command line sas -sysin ...
|
TempleCBE::run_sas_script("script.sas") |
Conclusion
By combining dedicated screening engines, automated assumption
validators, flexible argument forwarding, modern time-dependent interval
builders, and integrated IPCW Brier score calibration,
TempleCBE provides an end-to-end survival modeling
ecosystem in R whose PROC PHREG and Brier score results the
package tests check against reference values from real SAS runs, while
introducing modern tidy programming ergonomics and cross-platform
reproducibility for clinical study teams.