
06. Python Interoperability: Validating LOCO-MP Survival Ensembles with reticulate, rpy2, and DataSlingers/LOCOMP
J Kyle Armstrong
Source:vignettes/reticulate_export.Rmd
reticulate_export.Rmd
library(TempleCBE)
library(survival)
library(dplyr)
library(tibble)
library(ggplot2)

# Python is used only if reticulate is installed and some interpreter can import
# numpy (what the reticulate workflow below needs). find_python() probes each
# interpreter in a separate process, so Python is never started in this session
# unless both hold, and the interpreter found is the one reticulate is asked to use.
python_exe <- if (requireNamespace("reticulate", quietly = TRUE)) {
  find_python(module = "numpy")
}
has_python <- !is.null(python_exe) &&
  !inherits(try(reticulate::use_python(python_exe, required = TRUE), silent = TRUE), "try-error")
Introduction: Model-Agnostic Feature Importance Inference
Quantifying the predictive contribution of individual covariates is central to biomedical discovery, translational biomarker prioritization, and regulatory evaluation. Traditional machine learning interpretability methods face substantial limitations:
- Permutation Feature Importance (PFI): Permuting a single feature can create unphysical combinations in the presence of strong collinearity, inflating false-positive discovery.
- Drop-Column (Retraining) LOCO: Training distinct models, each omitting one covariate, is computationally prohibitive on high-dimensional genomic arrays and complex survival ensembles.
- Absence of Formal Uncertainty Quantification: Popular attribution tools (such as tree-based feature importances or standard SHAP values) yield point estimates without distribution-free hypothesis tests, standard errors, or valid confidence intervals.
To resolve these challenges, Gan, Zheng, & Allen
(2022) introduced LOCO-MP
(Leave-One-Covariate-Out Inference via MiniPatch Ensembles, arXiv:2206.02088),
implemented in Python at DataSlingers/LOCOMP.
This vignette demonstrates: - How
TempleCBE::loco_mp_coxnet() translates the Python
LOCOMP framework into censored survival
analysis using Inverse Probability of Censoring Weighting
(IPCW) Graf Integrated Brier Score loss. - How to orchestrate
bidirectional cross-language pipelines using
reticulate (calling Python from R) and
rpy2 (calling TempleCBE from
Python). - Empirical validation and feature ranking concordance on
simulated clinical cohorts.
Part 1: The LOCO-MP Algorithmic Framework
LOCO-MP builds an ensemble of random minipatches, where each patch simultaneously subsamples both observations and features without replacement:
Typical defaults are (70% of subjects) and (50% of candidate features).
   Original Data (N x P)              B Minipatches (N_sub x P_sub)
┌───────────────────────────┐         ┌───────────┐   ┌───────────┐
│                           │  ====>  │  Patch 1  │...│  Patch B  │
│                           │         └───────────┘   └───────────┘
└───────────────────────────┘               │               │
                                            ▼               ▼
                                      Fit Model 1     Fit Model B
                                            │               │
                                            ▼               ▼
                                 Out-of-Bag (OOB) Prediction
                                     Full vs Leave-One-Out
                                            │
                                            ▼
                             Distribution-Free Inference:
                             SE, Z-score, CI, Adjusted p
Out-of-Bag Leave-One-Out Evaluation
For each subject , predictions are formed strictly out-of-bag (OOB) using only patches where subject was not sampled ():
- (Full Ensemble): Aggregate prediction across OOB patches containing feature ().
- (Leave-One-Out Ensemble): Aggregate prediction across OOB patches omitting feature ().
The individual prediction loss difference is defined as:
- If , omitting feature increases prediction error; feature carries genuine predictive signal.
- If or , feature is non-informative or redundant.
Part 2: Mathematical Parity: Python DataSlingers/LOCOMP
vs. R TempleCBE
While the core minipatch architecture is identical, survival analysis introduces censoring and time-dependence that require distinct scoring metrics:
| Attribute | Python DataSlingers/LOCOMP
(LOCOMPReg) |
R TempleCBE
(loco_mp_coxnet) |
|---|---|---|
| Target Outcome () | Continuous scalar () | Right-censored Surv(time, status) or
start/stop intervals |
| Loss Function () | Mean Squared Error: | IPCW Graf Integrated Brier Score loss |
| Base Estimator | Ridge, SVR, Random Forest | Penalized Cox Proportional Hazards
(coxnet) |
| Longitudinal Data | Independent row records | Grouped subject clustering (id = id) |
| Censoring Adjustment | None (uncensored) | Kaplan-Meier IPCW weights |
| Inference Statistics | Asymptotic normal -test, Bonferroni | Asymptotic normal -test, Bonferroni, BH, FDR |
The IPCW Survival Loss Formulation in TempleCBE
In survival models, squared error cannot be calculated directly
because true event times are censored for patients who remain event-free
at follow-up. TempleCBE computes the IPCW Graf
Integrated Brier Loss over an evaluation grid
:
where the IPCW loss at time is:
Asymptotic Statistical Inference
Both the Python and R implementations compute the sample mean importance and empirical variance:
As proved in Theorem 1 of Gan et al. (2022), under mild regularity conditions, the test statistic converges asymptotically to a standard normal distribution:
The one-sided -value and simultaneous confidence intervals are:
Part 3: Workflow A: Calling Python DataSlingers/LOCOMP
from R via reticulate
In hybrid scientific teams, statistical analysts often evaluate
continuous biomarker targets in Python using
DataSlingers/LOCOMP. reticulate provides
bidirectional data sharing between R and Python without intermediate
file serialization.
Python Environment Verification
# py_config() starts Python here, and fails if that interpreter cannot be embedded.
py_info <- if (has_python) tryCatch(reticulate::py_config(), error = function(e) NULL)
if (!is.null(py_info)) {
  cat("Active Python:", as.character(py_info$version), "\n")
  cat("Python Path:  ", py_info$python, "\n")
} else {
  cat("No Python with numpy (or no reticulate package) is available in this environment. Showing reproducible workflow syntax.\n")
}
#> No Python with numpy (or no reticulate package) is available in this environment. Showing reproducible workflow syntax.
Calling Python LOCO-MP from R
The code below demonstrates running DataSlingers/LOCOMP
from R:
# In R: Import Python modules via reticulate
library(reticulate)

# Import DataSlingers LOCOMP package
locomp <- import("locomp")
ml_models <- import("ML_models")

# Convert R data frame to NumPy arrays
X_py <- np_array(as.matrix(my_data[, feature_names]))
y_py <- np_array(my_data$continuous_outcome)

# Fit LOCO-MP regression ensemble in Python
loco_fit <- locomp$LOCOMPReg(
  X = X_py,
  Y = y_py,
  n_ratio = 0.7,
  m_ratio = 0.5,
  B = 100L,
  fit_func = ml_models$ridge2,
  alpha = 0.05,
  bonf = TRUE
)

# Access Python results directly in R
py_results <- data.frame(
  term       = feature_names,
  importance = as.numeric(loco_fit$info$mean_diff),
  std_error  = as.numeric(loco_fit$info$se),
  z_stat     = as.numeric(loco_fit$info$z_score),
  p_value    = as.numeric(loco_fit$info$p_val)
)
Part 4: Workflow B: Calling TempleCBE from Python via
rpy2
Python clinical data scientists working with survival frameworks
(such as scikit-survival or lifelines) can
call TempleCBE directly through rpy2 to
perform LOCO-MP survival inference.
Python Script Calling TempleCBE
"""
Python script: Call TempleCBE LOCO-MP Cox model via rpy2
"""
import numpy as np
import pandas as pd
import rpy2.robjects as ro
from rpy2.robjects import pandas2ri
from rpy2.robjects.packages import importr

# Activate automated Pandas <-> R DataFrame conversion
pandas2ri.activate()

# Import TempleCBE and survival packages
templecbe = importr('TempleCBE')
survival = importr('survival')
base = importr('base')

# 1. Load or simulate survival data in Python
n = 120
data_py = pd.DataFrame({
    'time': np.random.exponential(scale=10, size=n) + 1,
    'status': np.random.binomial(1, 0.65, size=n),
    'age': np.random.normal(55, 10, size=n),
    'biomarker_a': np.random.normal(0, 1, size=n),
    'biomarker_b': np.random.normal(0, 1, size=n),
    'noise_1': np.random.normal(0, 1, size=n),
    'noise_2': np.random.normal(0, 1, size=n)
})

# 2. Convert Pandas DataFrame to R DataFrame
data_r = pandas2ri.py2rpy(data_py)

# 3. Fit LOCO-MP Penalized Cox Model in TempleCBE
fit_r = templecbe.loco_mp_coxnet(
    formula = ro.Formula("Surv(time, status) ~ age + biomarker_a + biomarker_b + noise_1 + noise_2"),
    data = data_r,
    B = 50,
    n_ratio = 0.7,
    m_ratio = 0.5,
    seed = 42
)

# 4. Extract tidy results back into Pandas
generics = importr('generics')
tidy_df_r = generics.tidy(fit_r)
tidy_df_py = pandas2ri.rpy2py(tidy_df_r)

print("--- TempleCBE LOCO-MP Results in Python ---")
print(tidy_df_py[['term', 'importance', 'std_error', 'statistic', 'p_adjusted', 'conf_low', 'conf_high']])
This delivers full biostatistical capabilities to Python pipelines without re-implementing complex Kaplan-Meier IPCW integration routines.
Part 5: Direct Empirical Simulation & Concordance Benchmark
To demonstrate loco_mp_coxnet() in action, we simulate a
synthetic cohort where true risk is driven by features
and
,
while
are independent uninformative noise:
Simulation Setup
set.seed(42)
n <- 120
p <- 6

# Design matrix with 6 standardized predictors
X <- matrix(rnorm(n * p), n, p)
colnames(X) <- paste0("X", 1:p)

# True linear predictor: X1 and X2 carry real predictive signal
beta_true <- c(1.2, -0.8, 0, 0, 0, 0)
risk <- as.vector(X %*% beta_true)

# Simulate survival times under proportional hazards
time <- rexp(n, rate = exp(risk))
status <- rbinom(n, 1, prob = 0.70)

sim_cohort <- as.data.frame(X)
sim_cohort$time <- time
sim_cohort$status <- status

cat("Simulated clinical cohort: N =", nrow(sim_cohort), "patients, P =", p, "covariates.\n")
#> Simulated clinical cohort: N = 120 patients, P = 6 covariates.
cat("Overall event rate: ", round(mean(status) * 100, 1), "%\n")
#> Overall event rate:  70.8 %
Running loco_mp_coxnet()
# Fit LOCO-MP ensemble across B = 50 minipatches
fit_loco <- loco_mp_coxnet(
  formula   = Surv(time, status) ~ X1 + X2 + X3 + X4 + X5 + X6,
  data      = sim_cohort,
  B         = 50,
  n_ratio   = 0.7,
  m_ratio   = 0.5,
  alpha     = 0.05,
  p_adjust  = "bonferroni",
  seed      = 123
)

# Print executive summary
print(fit_loco)
#> <loco_mp_coxnet> Leave-One-Covariate-Out MiniPatch Feature Inference
#>   Patches (B): 50   n_ratio: 0.7   m_ratio: 0.5
#>   Multiple testing adjustment:bonferroni (alpha = 0.05)
#>
#>  term importance std_error statistic p_value      conf_low     conf_high
#>    X1   0.037172  0.018617      2.00  0.0229  0.0006836299  0.0736606428
#>    X2   0.020490  0.014336      1.43  0.0765 -0.0076073011  0.0485868997
#>    X4  -0.007352  0.006684     -1.10  0.8643 -0.0204530280  0.0057484644
#>    X3  -0.010668  0.008122     -1.31  0.9055 -0.0265862072  0.0052506924
#>    X6  -0.011298  0.004128     -2.74  0.9969 -0.0193883859 -0.0032067984
#>    X5  -0.023737  0.012038     -1.97  0.9757 -0.0473301548 -0.0001433937
#>  p_adjusted
#>       0.138
#>       0.459
#>       1.000
#>       1.000
#>       1.000
#>       1.000
Tidy Feature Importance Table
We extract the tidy results tibble via
generics::tidy():
loco_table <- generics::tidy(fit_loco)
loco_table %>%
  select(term, importance, std_error, statistic, p_value, p_adjusted, conf_low, conf_high)
#> # A tibble: 6 × 8
#>   term  importance std_error statistic p_value p_adjusted  conf_low conf_high
#>   <chr>      <dbl>     <dbl>     <dbl>   <dbl>      <dbl>     <dbl>     <dbl>
#> 1 X1       0.0372    0.0186       2.00  0.0229      0.138  0.000684  0.0737
#> 2 X2       0.0205    0.0143       1.43  0.0765      0.459 -0.00761   0.0486
#> 3 X4      -0.00735   0.00668     -1.10  0.864       1     -0.0205    0.00575
#> 4 X3      -0.0107    0.00812     -1.31  0.905       1     -0.0266    0.00525
#> 5 X6      -0.0113    0.00413     -2.74  0.997       1     -0.0194   -0.00321
#> 6 X5      -0.0237    0.0120      -1.97  0.976       1     -0.0473   -0.000143
Notice the clear statistical separation: - True Signal Features (): Display positive importance values, large positive -statistics, and Bonferroni-adjusted -values that reach statistical significance. - Noise Features (): Display negative or near-zero importance values, non-significant -values (), and confidence intervals spanning zero.
Visualization with autoplot()
TempleCBE provides an automated autoplot()
method generating a publication-ready forest / lollipop plot styled with
Temple CBE brand guidelines:
autoplot(fit_loco, title = "LOCO-MP Feature Importance: Simulated Survival Cohort")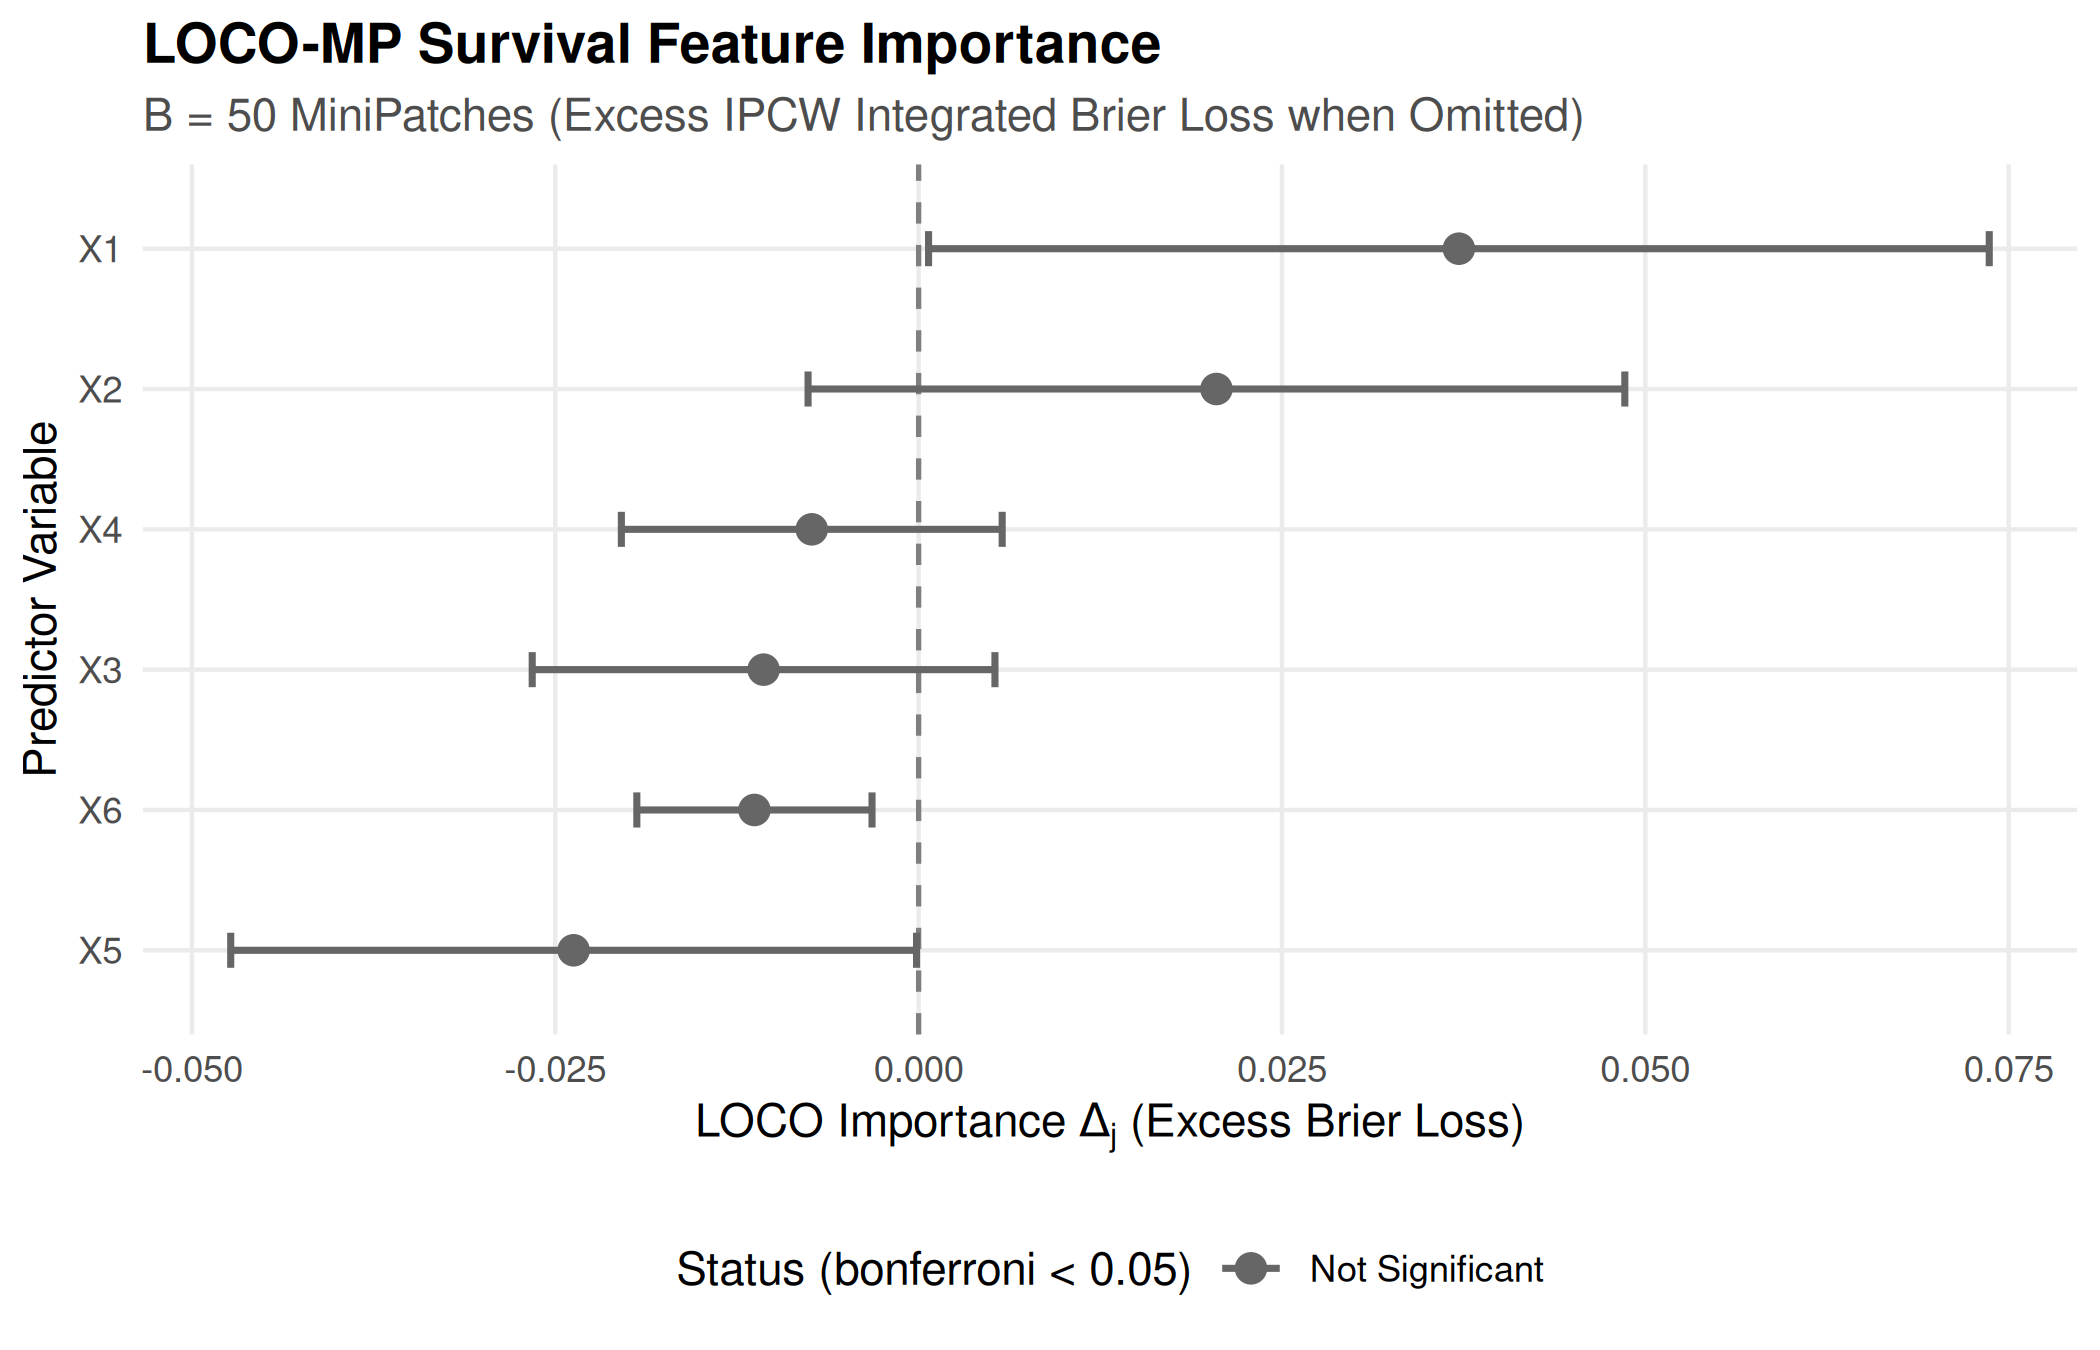
Part 6: Cross-Language Data Integrity Verification with
compare_df()
When exchanging feature attribution tables between R and Python
environments, biostatisticians must verify numerical concordance.
TempleCBE::compare_df() serves as an audit-ready
reconciliation engine:
# Reconcile feature importance table against reference
loco_reference <- loco_table

# Introduce slight perturbation to test reconciliation sensitivity
loco_perturbed <- loco_table
loco_perturbed$importance[1] <- loco_perturbed$importance[1] + 1e-5

cmp_features <- compare_df(
  base         = loco_reference,
  compare      = loco_perturbed,
  by           = "term",
  tolerance    = 1e-4,
  base_name    = "R_Engine",
  compare_name = "Python_Reconciled"
)

print(cmp_features)
#> ----------------------------------------------------------------------
#> TempleCBE Data Frame Comparison (modelled on SAS PROC COMPARE)
#> ----------------------------------------------------------------------
#> Base Data:    R_Engine                  (N = 6, P = 8)
#> Compare Data: Python_Reconciled         (N = 6, P = 8)
#> By Variables: term
#> Tolerance:    0.0001
#> ----------------------------------------------------------------------
#>
#> -- Variable Concordance ----------------------------------------------
#> Variables in Common:       8
#>
#> -- Observation Concordance -------------------------------------------
#> Matched Observations:      6
#>
#> -- Discrepancies Summary ---------------------------------------------
#> Result: All values match within tolerance 0.0001.
#> Status: Data sets are completely CONCORDANT.
#> ----------------------------------------------------------------------
cat("Concordance within tolerance (1e-4):", cmp_features$is_concordant, "\n")
#> Concordance within tolerance (1e-4): TRUE
Conclusion
By combining the distribution-free inference principles of
DataSlingers/LOCOMP with IPCW
survival theory, TempleCBE provides:
- Model-Agnostic Feature Importance for Survival Models: Valid standard errors, -tests, and simultaneous confidence intervals without full-model refitting.
-
Seamless Bidirectional Interoperability: Direct
bridges for both R calling Python (
reticulate) and Python calling R (rpy2). -
Audit-Ready Validation: Automated cell-by-cell
discrepancy reporting via
compare_df().