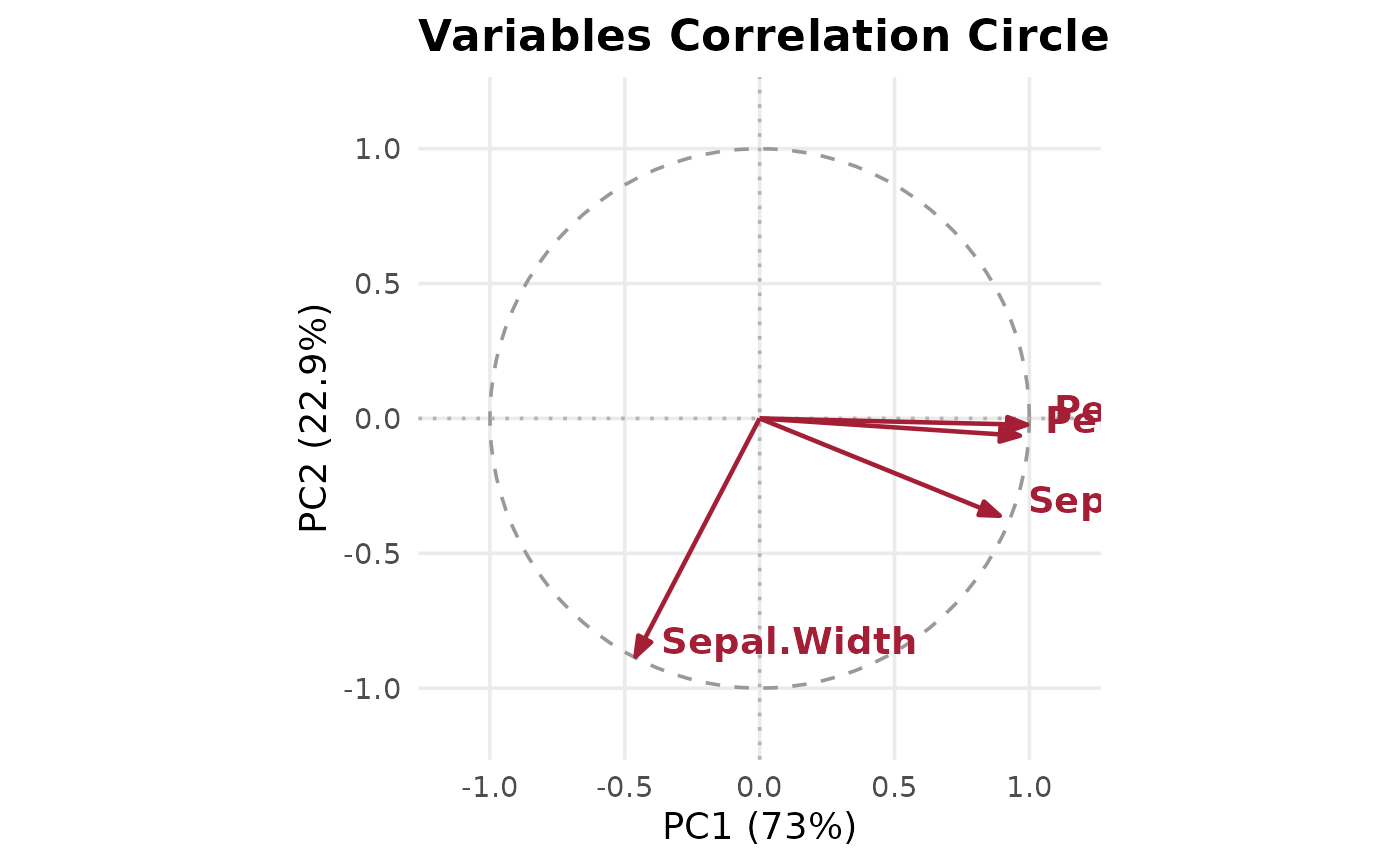
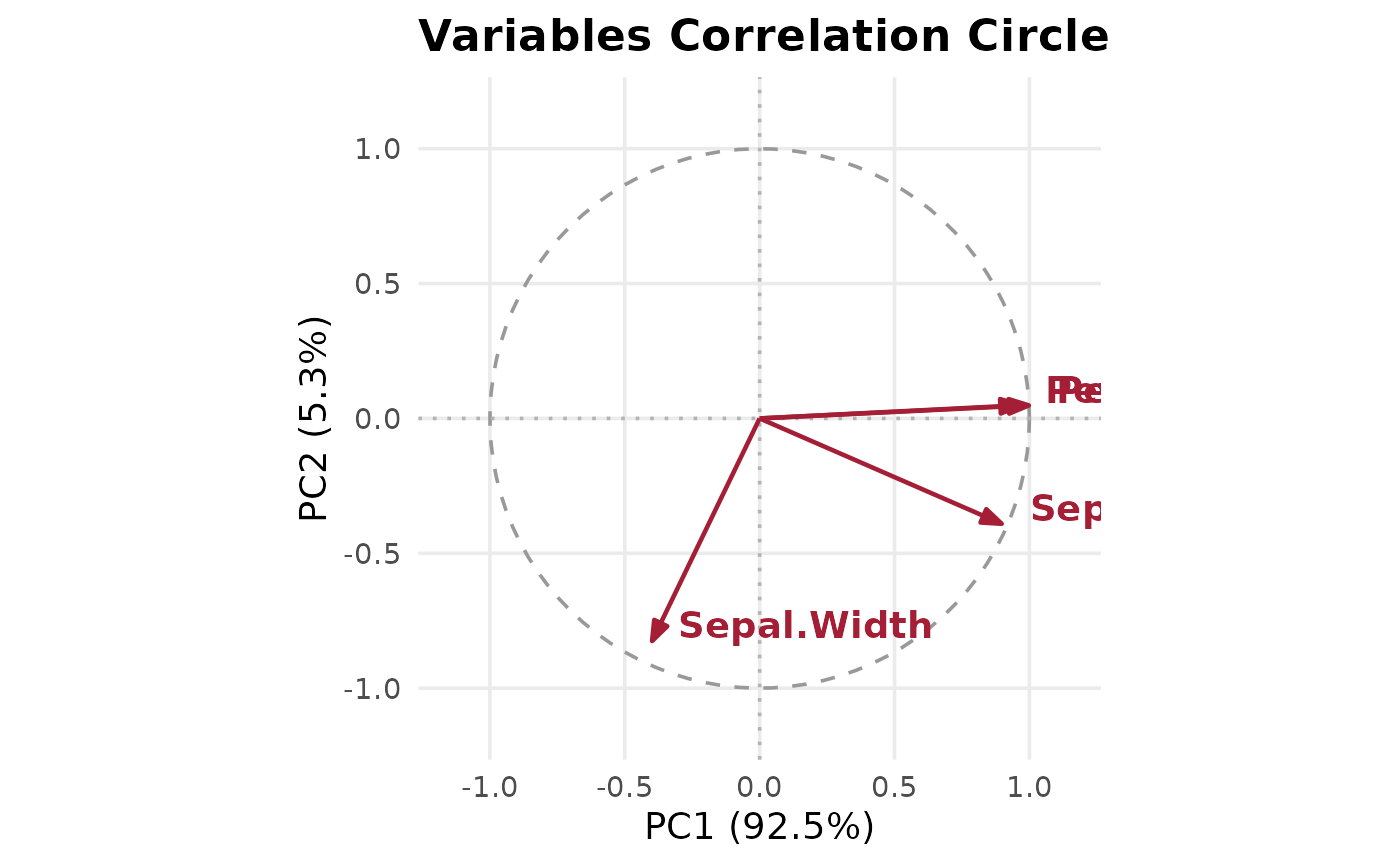
Plots the projection of variables onto the unit circle for two principal components, showing correlations between original variables and principal components.
Usage
pca_variables_plot(
  pca_model,
  x = 1,
  y = 2,
  title = "Variables Correlation Circle",
  data = NULL
)
Arguments
- pca_model
- x, y
Which principal components to plot (default 1, 2).
- title
Optional plot title (default
"Variables Correlation Circle").- data
Optional data frame or matrix holding the original variables (numeric, with a column for each variable of
pca_model, matched by name). When given, the arrows showcor(data, scores), the correlations between the variables and the component scores ofdata, whatever the scaling ofpca_model, and the unscaled warning is not given. DefaultNULL: loading times standard deviation.
Details
Each arrow ends at the variable's loading times the component's standard
deviation. For a PCA of standardised variables
(prcomp(scale. = TRUE), a correlation-matrix PCA) that is the
correlation between the variable and the component, so every arrow lies
inside the unit circle. For a PCA of unscaled variables (the
prcomp default, scale. = FALSE) it is a
covariance in the units of the data, which can exceed 1, and the function
warns. A prcomp object does not keep the data it was fit to, so
either refit with prcomp(scale. = TRUE) or give the original
variables as data, which computes the correlations directly.
Fits truncated with rank. or tol are supported: the percent
of variance on the axis labels is still the share of the total variance.