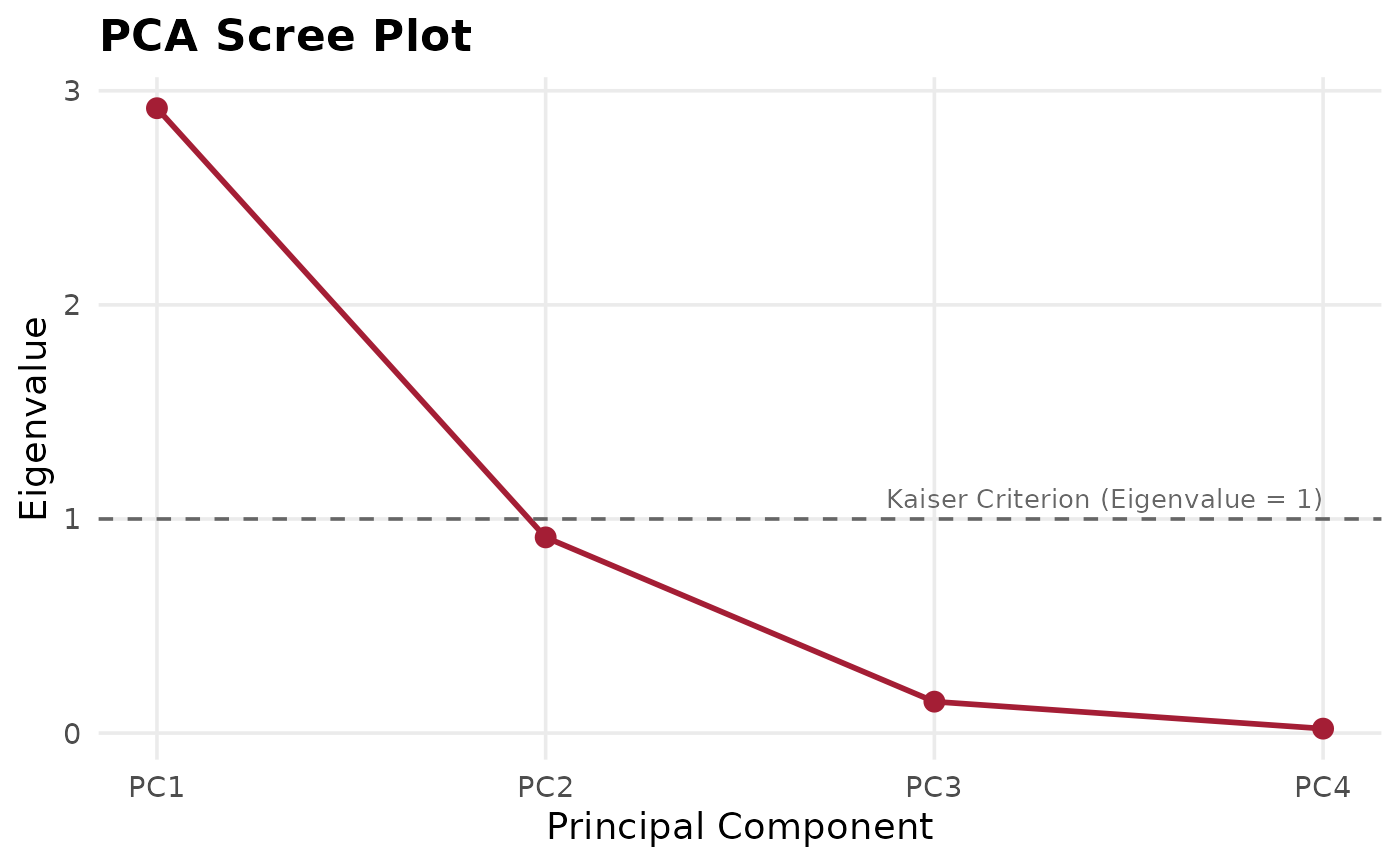
Scree plot displaying the eigenvalues or proportion of variance explained by each principal component, with an optional horizontal reference line at eigenvalue = 1 (Kaiser-Guttman criterion).
Usage
pca_scree_plot(
  pca_model,
  metric = c("eigenvalue", "variance"),
  kaiser = TRUE,
  title = "PCA Scree Plot"
)Examples
pca_model <- prcomp(iris[, 1:4], center = TRUE, scale. = TRUE)
pca_scree_plot(pca_model)