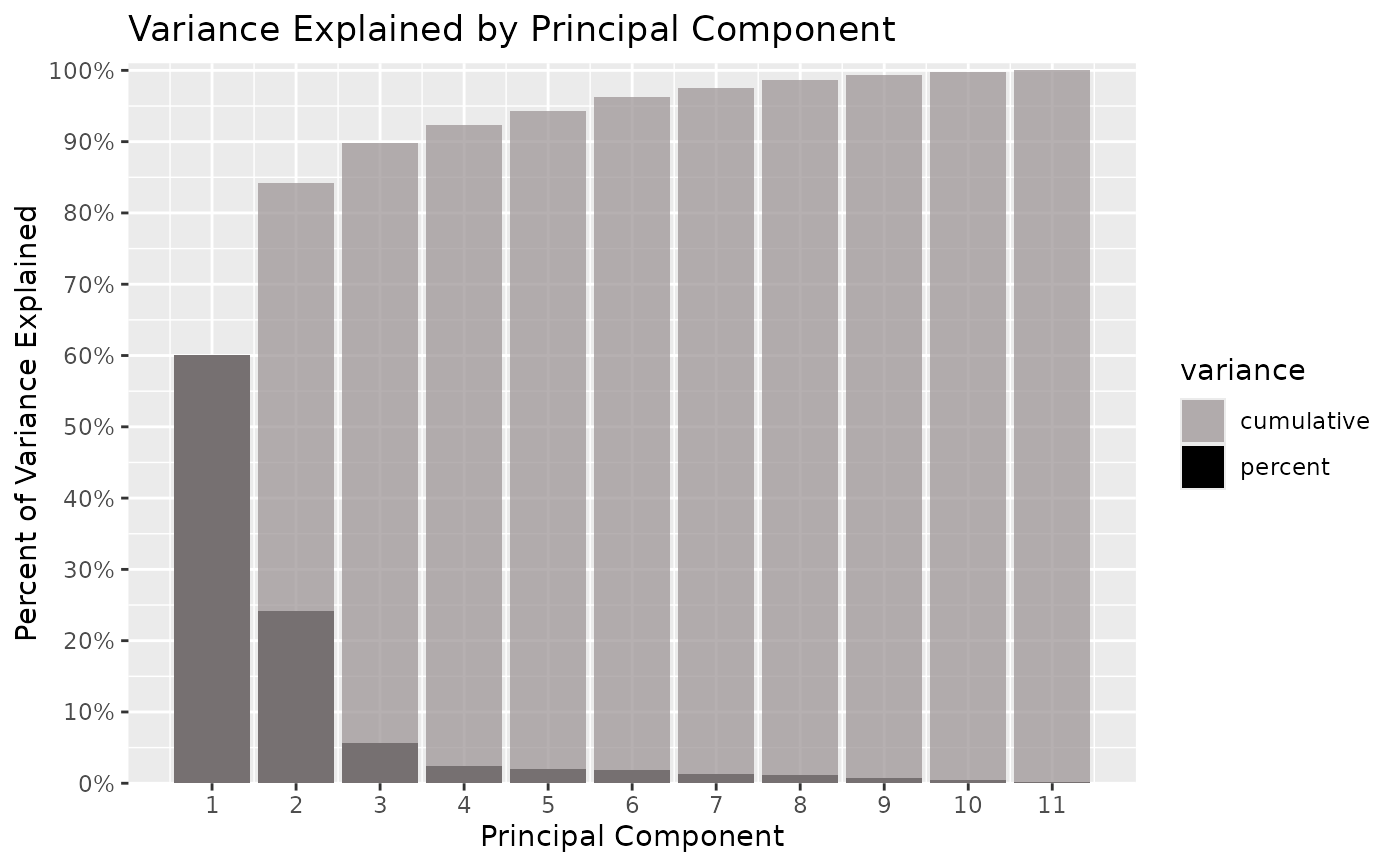
Percent Variance Explained by Each Principal Component
Source:R/pca_plots.R
pca_percent_var_explained.RdThe percentages come from the component standard deviations
(pca_model$sdev), as in pca_scree_plot, and are shares
of the total variance. A fit truncated with rank. or tol
still stores every standard deviation, so all components are shown.
Examples
pca_model <- prcomp(mtcars, center = TRUE, scale. = TRUE)
pca_percent_var_explained(pca_model)