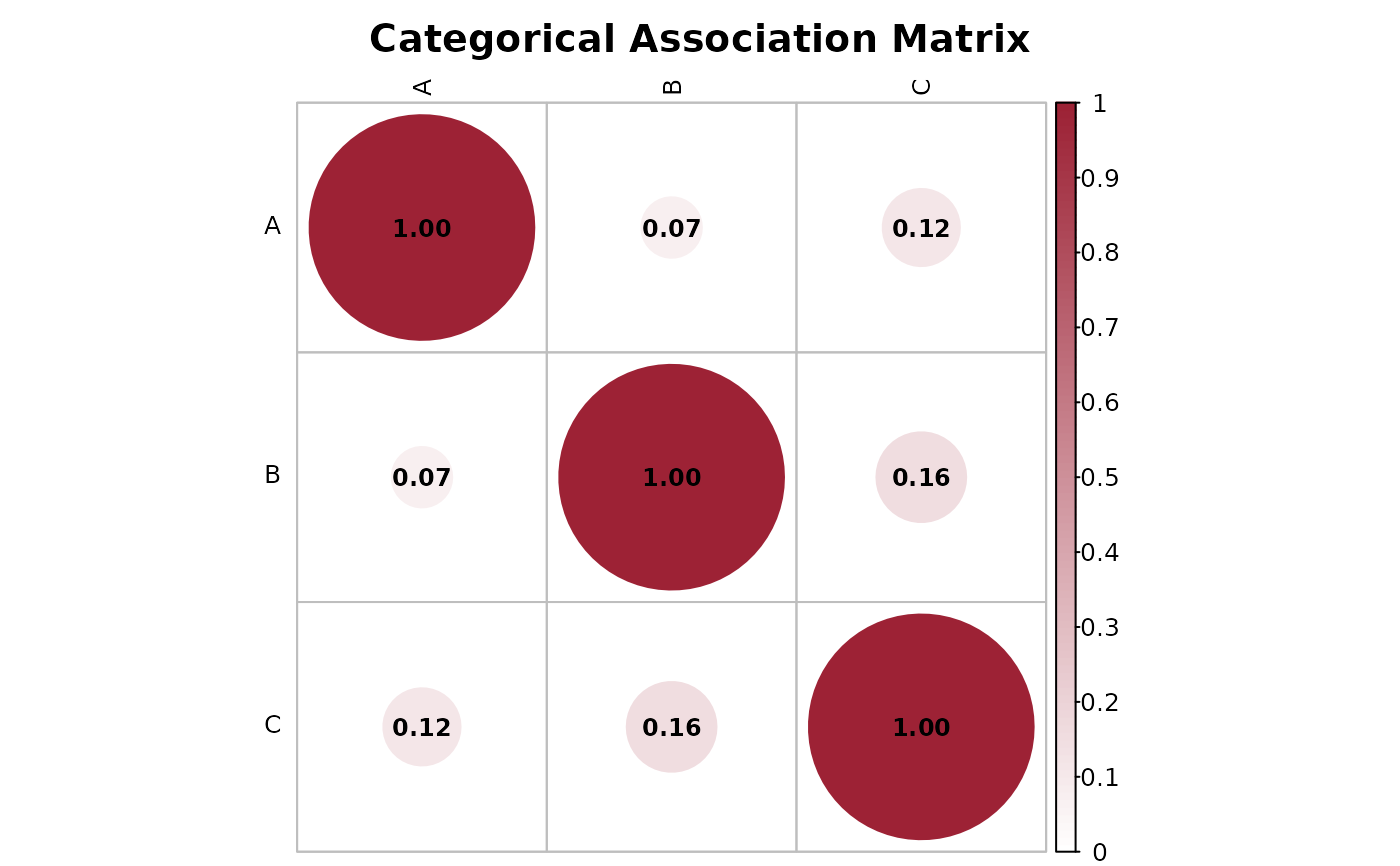
Plot Categorical Association Matrix Using corrplot
Source:R/plot_pairwise_categorical.R
plot_categorical_associations.RdComputes pairwise associations (Cramer's V or -log10 p-values) across all
categorical/factor columns in a data frame and renders an association matrix plot
via corrplot. This complements correlation_plot for numeric
variables.
Arguments
- data
A data frame or tibble.
- cols
Optional character vector of column names to include. If
NULL, all factor and character columns are selected.- method
Association metric:
"cramer_v"(Cramer's V correlation, default) or"p_value"(\(-\log_{10}(p)\)). For"p_value", 2x2 pairs use the exact test ofexact2x2and larger tables use the asymptotic Pearson chi-squared test, so every pair is on the same deterministic scale (a simulated Fisher p-value cannot fall below1 / (B + 1)). Values are capped at 16.- title
Plot title (defaults to
"Categorical Association Matrix").- fill_colors
Character vector for the color gradient (defaults to Temple palette).
- tl.cex
Label character expansion (default 0.8).
- number.cex
Numeric value character expansion inside circles (default 0.75).
- show_coef
Logical (default
TRUE); whether to print coefficients.- ...
Additional arguments passed to
corrplot.