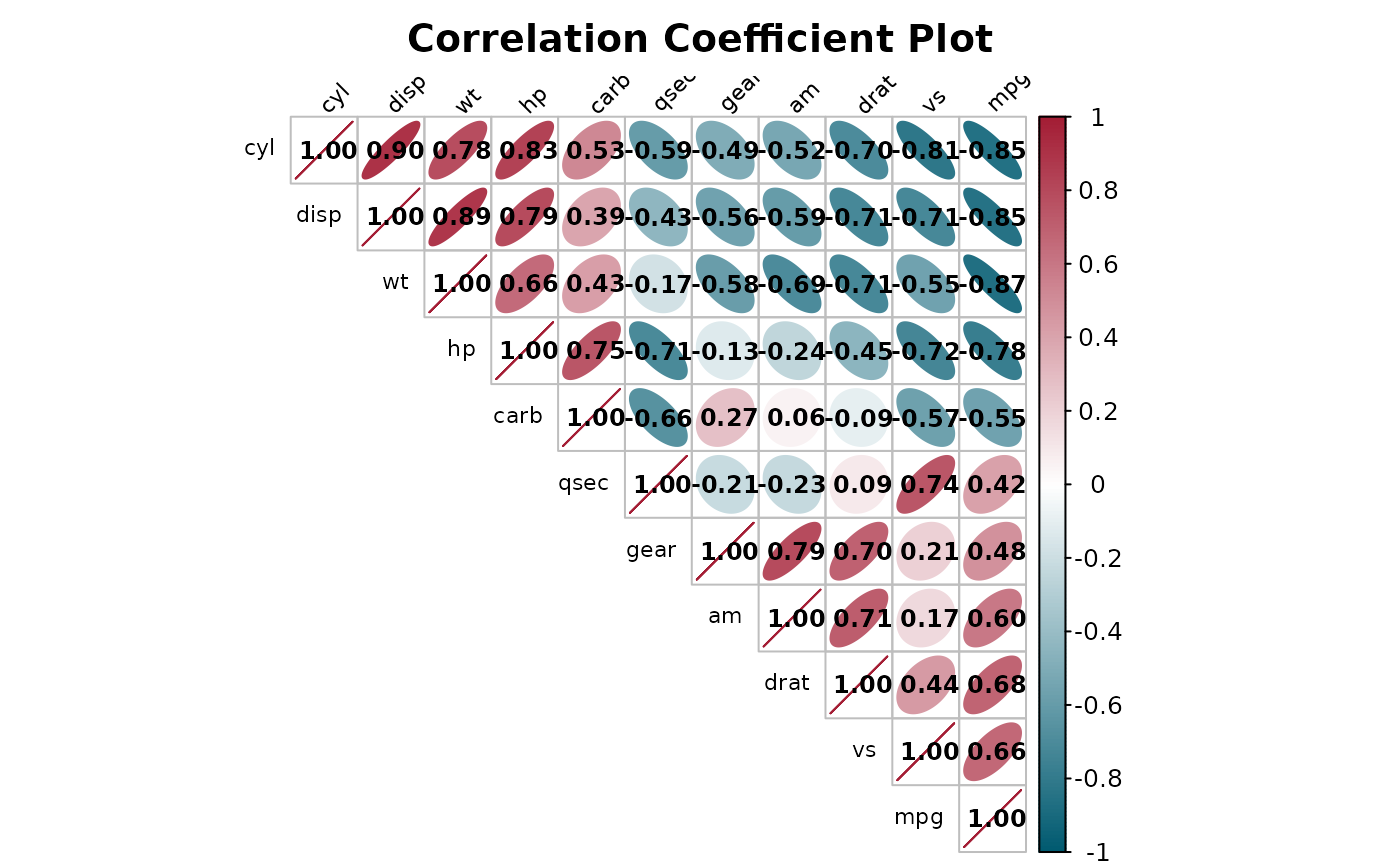
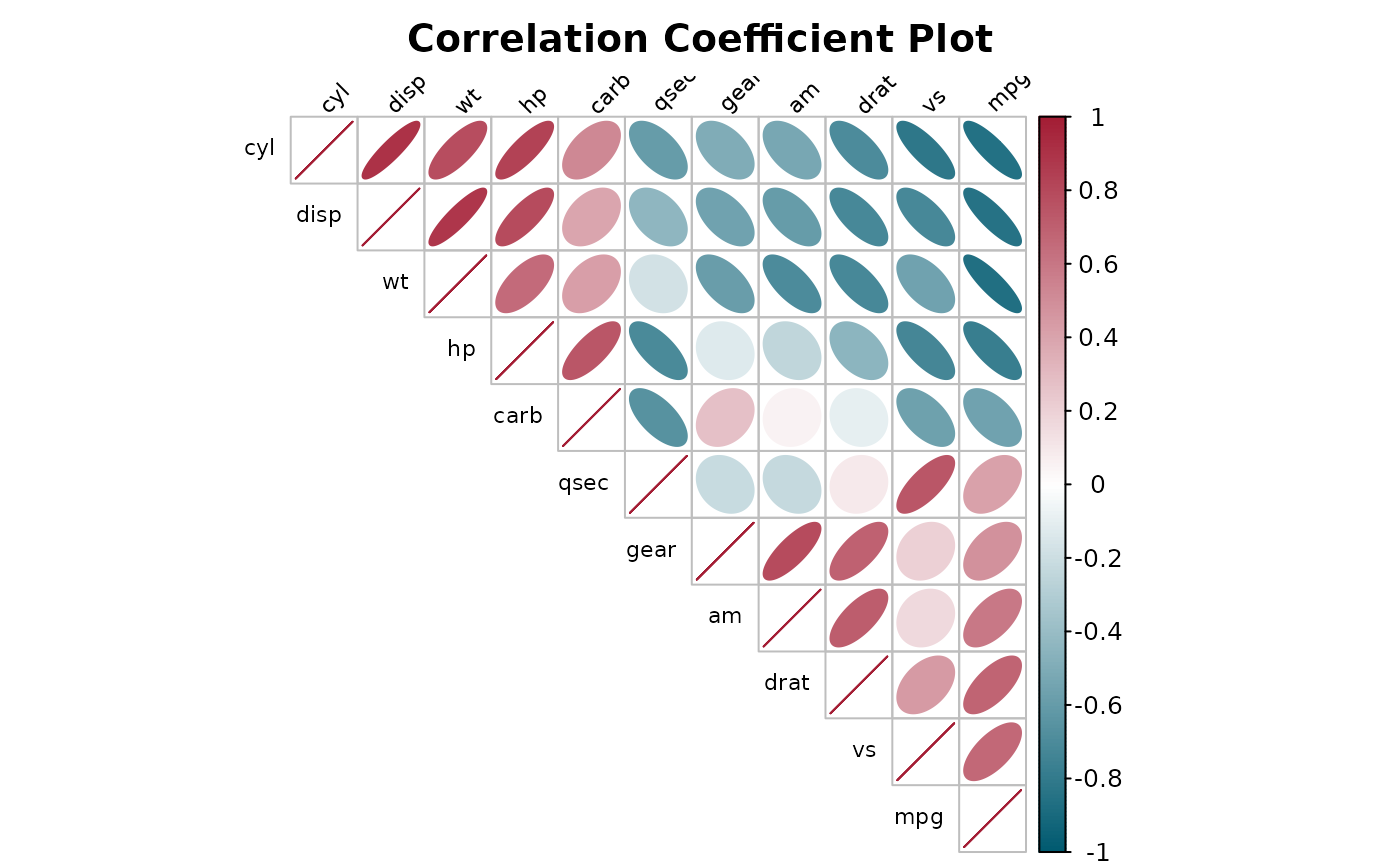
Plots a correlation matrix across all numeric columns of data
using corrplot.
Usage
correlation_plot(
  data,
  cor.use = "everything",
  cor.method = "pearson",
  method = "ellipse",
  type = "upper",
  order = "FPC",
  title = "Correlation Coefficient Plot",
  na_omit = TRUE,
  tl.cex = 0.5,
  number.cex = 0.75,
  tl.srt = 45,
  mar = c(0, 0, 2, 0),
  show_coef = TRUE,
  ...
)
Arguments
- data
A data frame or tibble.
- cor.use
Passed to
cor:"everything"(default),"all.obs","complete.obs","na.or.complete", or"pairwise.complete.obs".- cor.method
Passed to
cor:"pearson"(default),"kendall", or"spearman".- method
Visualization method passed to
corrplot(default"ellipse").- type
"upper"(default),"full", or"lower".- order
Ordering method for the correlation matrix (default
"FPC", first principal component order).- title
Plot title.
- na_omit
Logical (default
TRUE); drop rows with anyNAamong the numeric columns before computing correlations.- tl.cex, number.cex, tl.srt
Label/number sizing and rotation, passed to
corrplot.- mar
Plot margin, passed to
corrplotin the standardpar("mar")formc(bottom, left, top, right)(defaultc(0, 0, 2, 0)).corrplot()does not otherwise reserve any extra space above the matrix fortitle, so with the default (zero) margin the title text collides with the 45-degree diagonal column labels sitting just below it; the default here adds two lines of top margin so the title clears the labels. Increase further if using a long title or a largertl.cex.- show_coef
Logical (default
TRUE); whether to draw the correlation coefficient inside each cell. On a small matrix the numbers add useful precision on top of the visual encoding, but on a large matrix (many variables) they quickly overlap each other and the diagonal labels. Set toFALSEto omit them entirely – this is the clean way to declutter a large matrix; shrinkingtl.cexandnumber.cexdown to near-zero to visually "hide" the numbers (as earlier callers did) also erases the variable name labels and should be avoided. Seecorrelation_plot_splitfor an alternative that keeps coefficients readable by splitting a large matrix into several smaller plots instead of hiding them.- ...
Additional arguments passed to
corrplot.