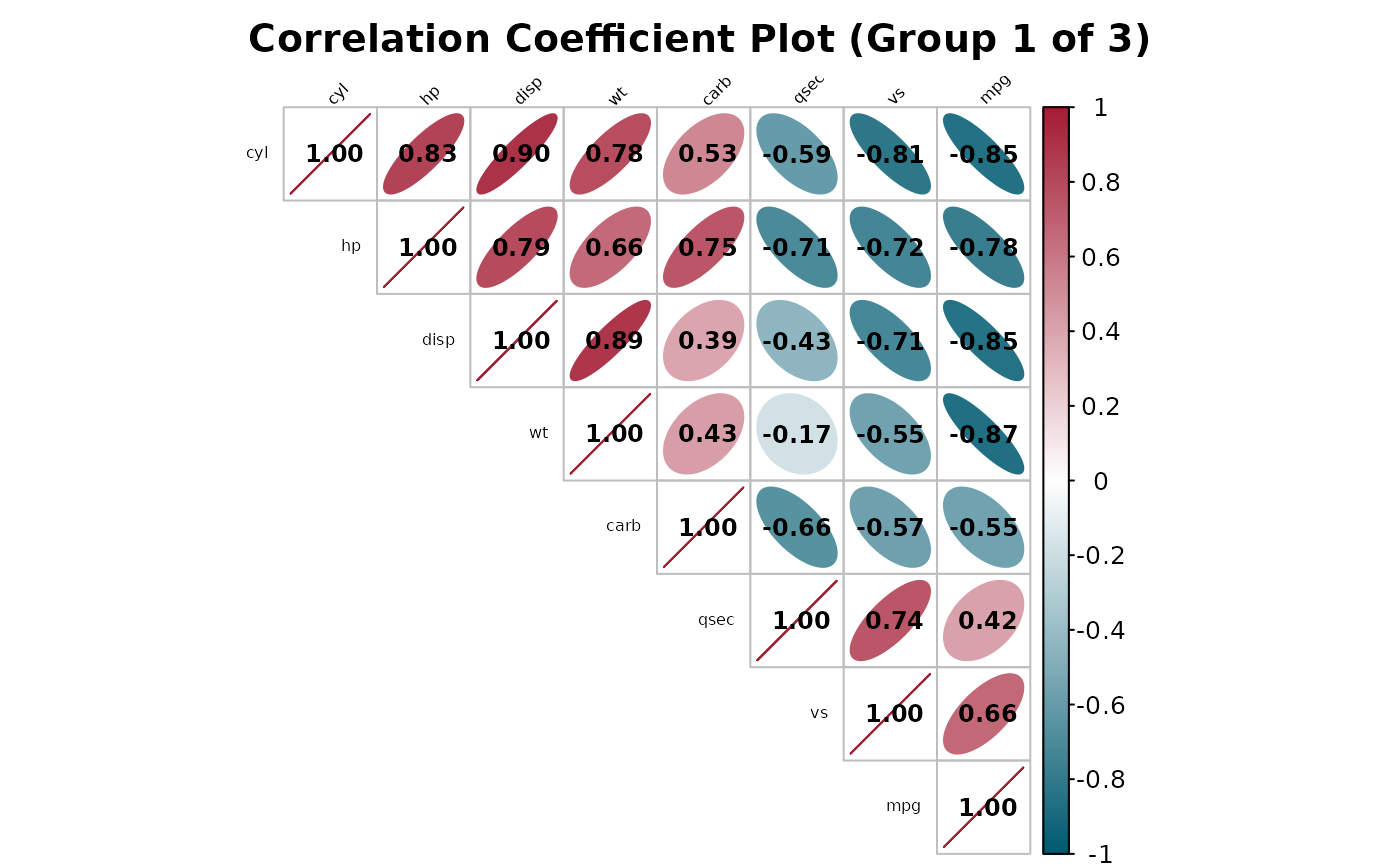
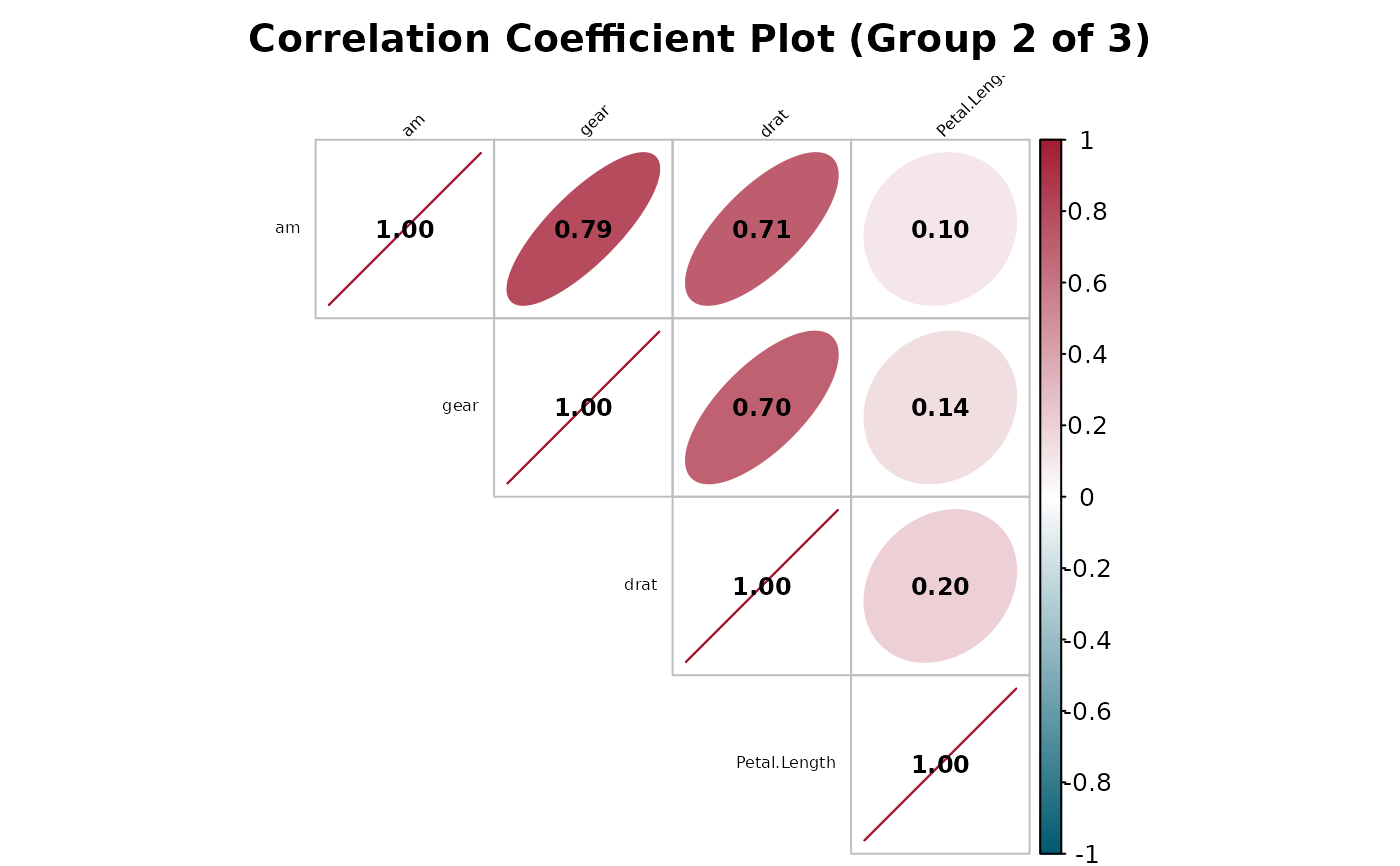
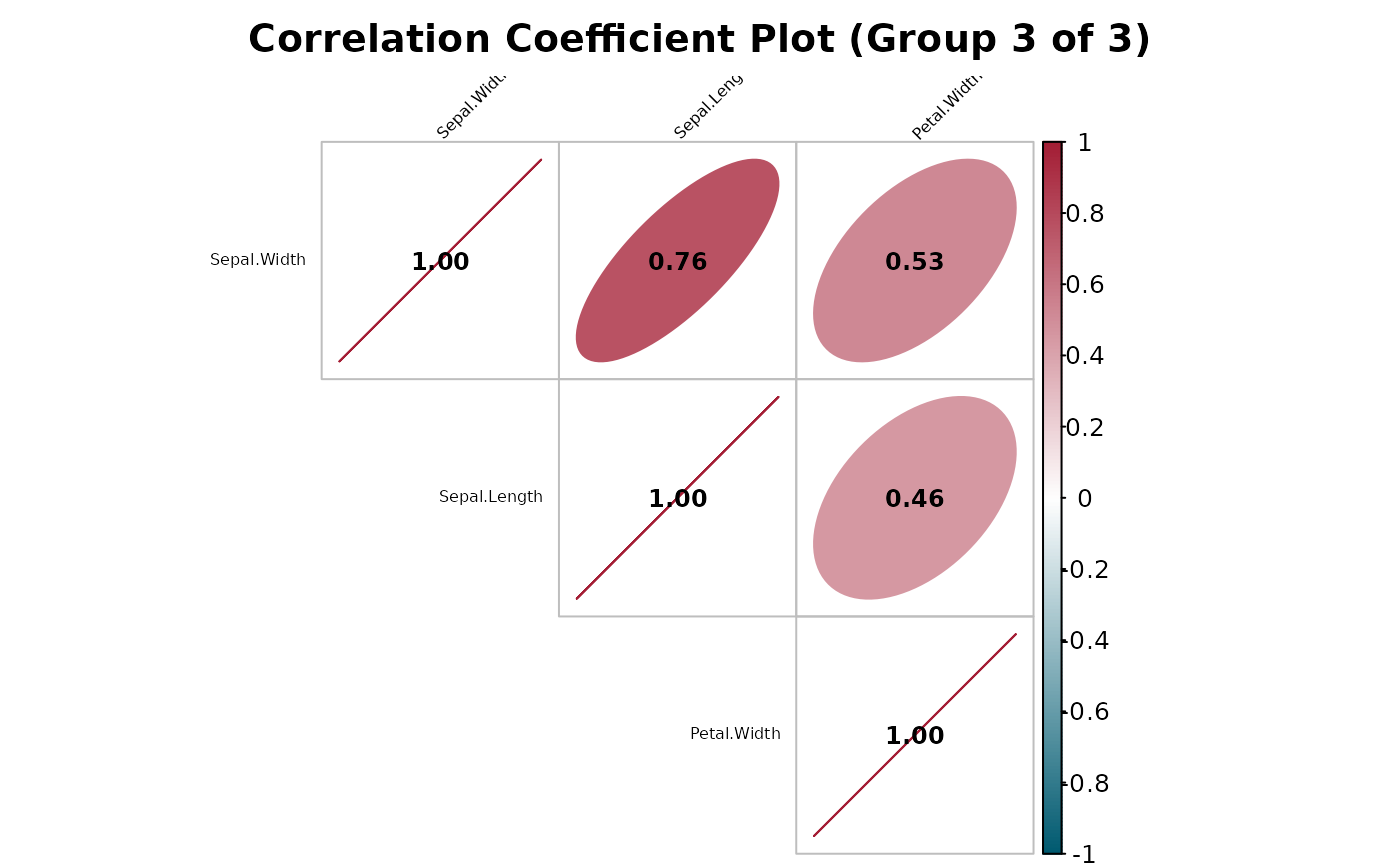
Correlation Plot, Split Into Legible Sub-Plots
Source:R/correlation_plot.R
correlation_plot_split.RdDraws the same style of correlation matrix as correlation_plot,
but for matrices with too many variables to stay legible in a single plot
(for example, ~40 clinical parameters), it first groups variables via
hierarchical clustering on their correlation structure and then draws one
correlation_plot-style plot per group, showing only the
within-group correlations.
Usage
correlation_plot_split(
  data,
  cor.use = "everything",
  cor.method = "pearson",
  na_omit = TRUE,
  group_size = 12,
  title = "Correlation Coefficient Plot",
  ...
)
Arguments
- data
A data frame or tibble.
- cor.use, cor.method, na_omit
See
correlation_plot.- group_size
Target number of variables per sub-plot (default 12). The number of groups is
ceiling(n_vars / group_size); groups may end up somewhat smaller or larger than this target sincecutreeproduces clusters of whatever sizes the dendrogram structure dictates, not exactly equal-sized groups.- title
Base plot title; each sub-plot's title has
" (Group i of n)"appended so the sub-plots can be told apart.- ...
Additional arguments passed on to
correlation_plotfor each sub-plot (e.g.tl.cex,show_coef,method).
Value
Invisibly, a named list of per-group correlation matrices (one
matrix per sub-plot, named "Group 1", "Group 2", ...).
Details
Variables are clustered on as.dist(1 - abs(cor_mat)) – the same
correlation-based distance corrplot's own order = "hclust"
uses internally – so that variables which move together end up in the
same sub-plot instead of being split arbitrarily (e.g. alphabetically).
The resulting dendrogram is cut into ceiling(n_vars / group_size)
contiguous groups via cutree.
The default group_size of 12 is chosen to match
correlation_plot's own defaults: at the default
tl.cex/number.cex, a matrix of roughly a dozen variables is
about as many as can fit one legible diagonal label and coefficient per
cell without crowding – the same order of magnitude as the small examples
(like mtcars's 11 numeric columns) correlation_plot() was
originally tuned against. Larger or smaller groups can be requested via
group_size depending on label length and plot size.