Heatmap of Correlation Differences Between Two Datasets
Source:R/correlation_plot.R
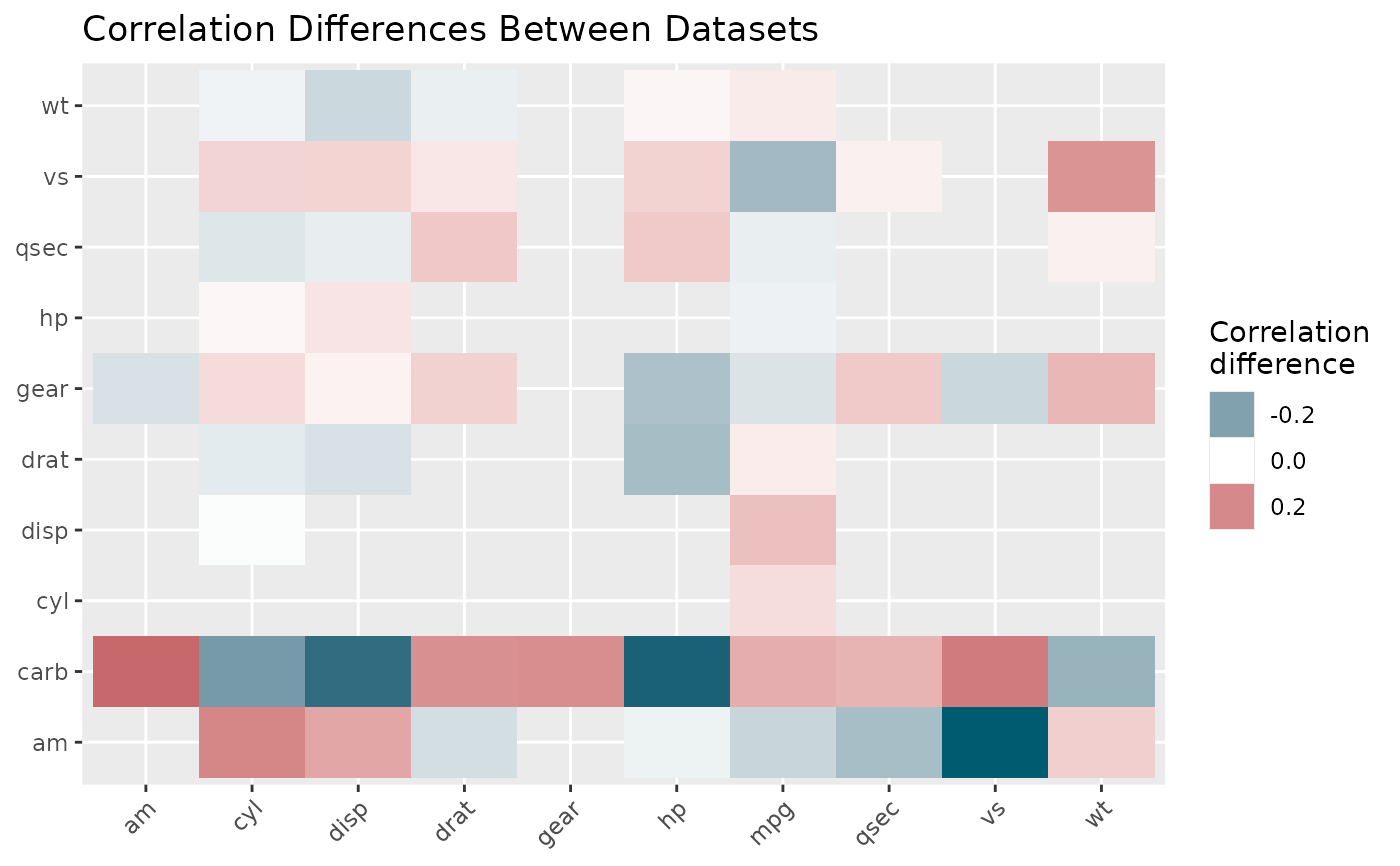
correlation_diff_heatmap.RdRenders the output of correlation_diff as a heatmap
(variable by variable), using the same visual language as
pca_loading_diff_heatmap: a diverging fill scale centered at
zero, so variable pairs with little change are white and larger
correlation changes in either direction stand out in Temple Night Owl or cherry.
Usage
correlation_diff_heatmap(
  baseline_data,
  comparison_data,
  cor.use = "everything",
  cor.method = "pearson",
  na_omit = TRUE
)
Arguments
- baseline_data
A data frame or tibble treated as the reference.
- comparison_data
A data frame or tibble to compare against
baseline_data.- cor.use, cor.method, na_omit
See
correlation_plot.