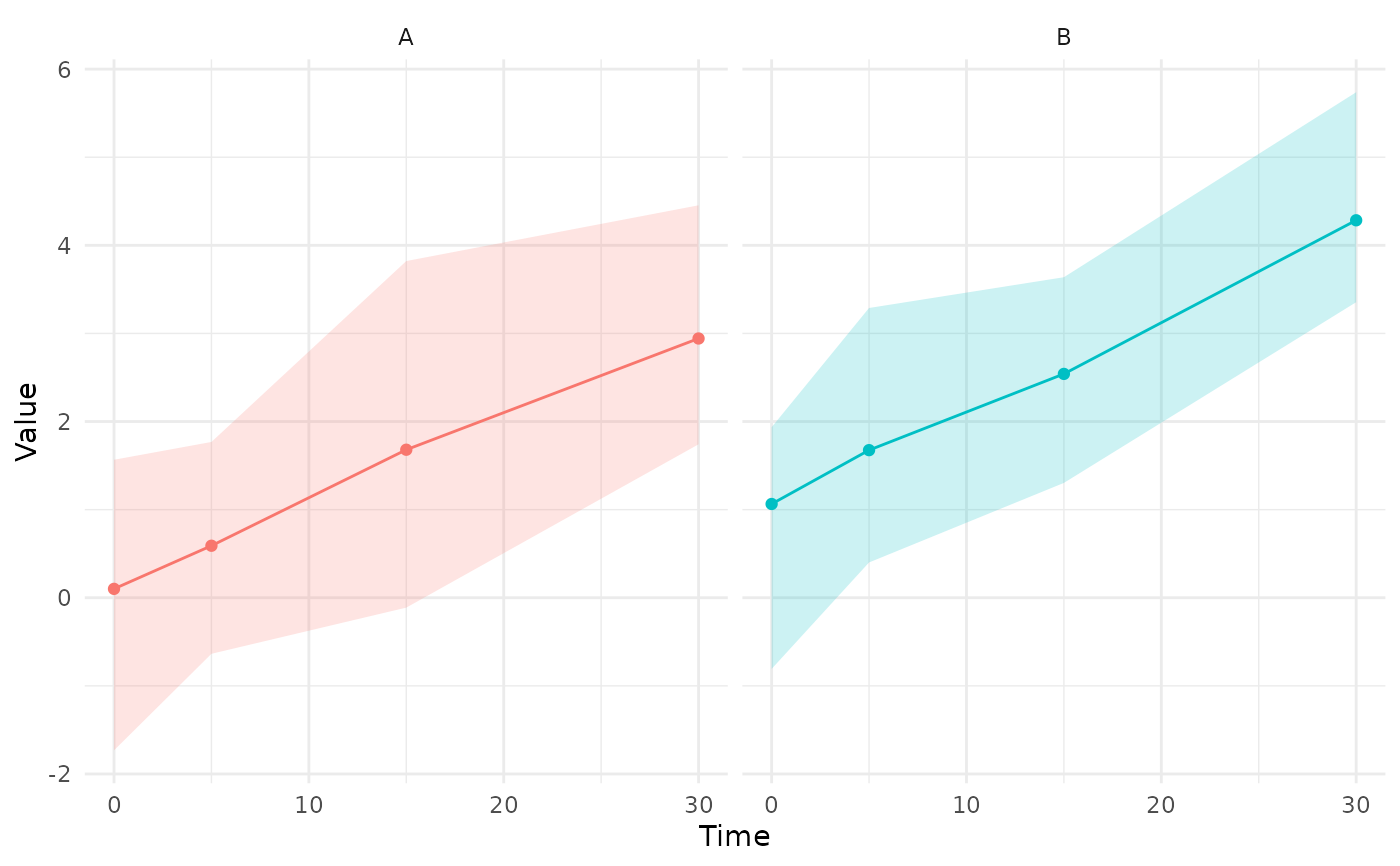
Group Trajectories with Empirical Quantile Ribbons
Source:R/plot_trajectory_group_ci.R
plot_trajectory_group_ci.RdMean trajectory per group over time with a ribbon between two empirical quantiles of the subjects' values at each time (not a confidence interval of the mean; the ribbon shows where most subjects lie). For individual trajectories by outcome use [plot_dynamic_trajectory()].
Usage
plot_trajectory_group_ci(
  data,
  time_col = "time",
  value_col = "value",
  group_col = "new_group",
  id_col = "subject_id",
  ci_quantiles = c(0.025, 0.975),
  facet = TRUE,
  title = NULL,
  xlab = "Time",
  ylab = "Value"
)
Arguments
- data
A data frame in long format.
- time_col, value_col, group_col
Time, value and group columns.
- id_col
Subject column. Several rows of one subject at one time are averaged first, so each subject counts once per time.
- ci_quantiles
Lower and upper quantile of the ribbon.
- facet
One panel per group (`TRUE`) or all groups in one panel, distinguished by colour.
- title, xlab, ylab
Labels.