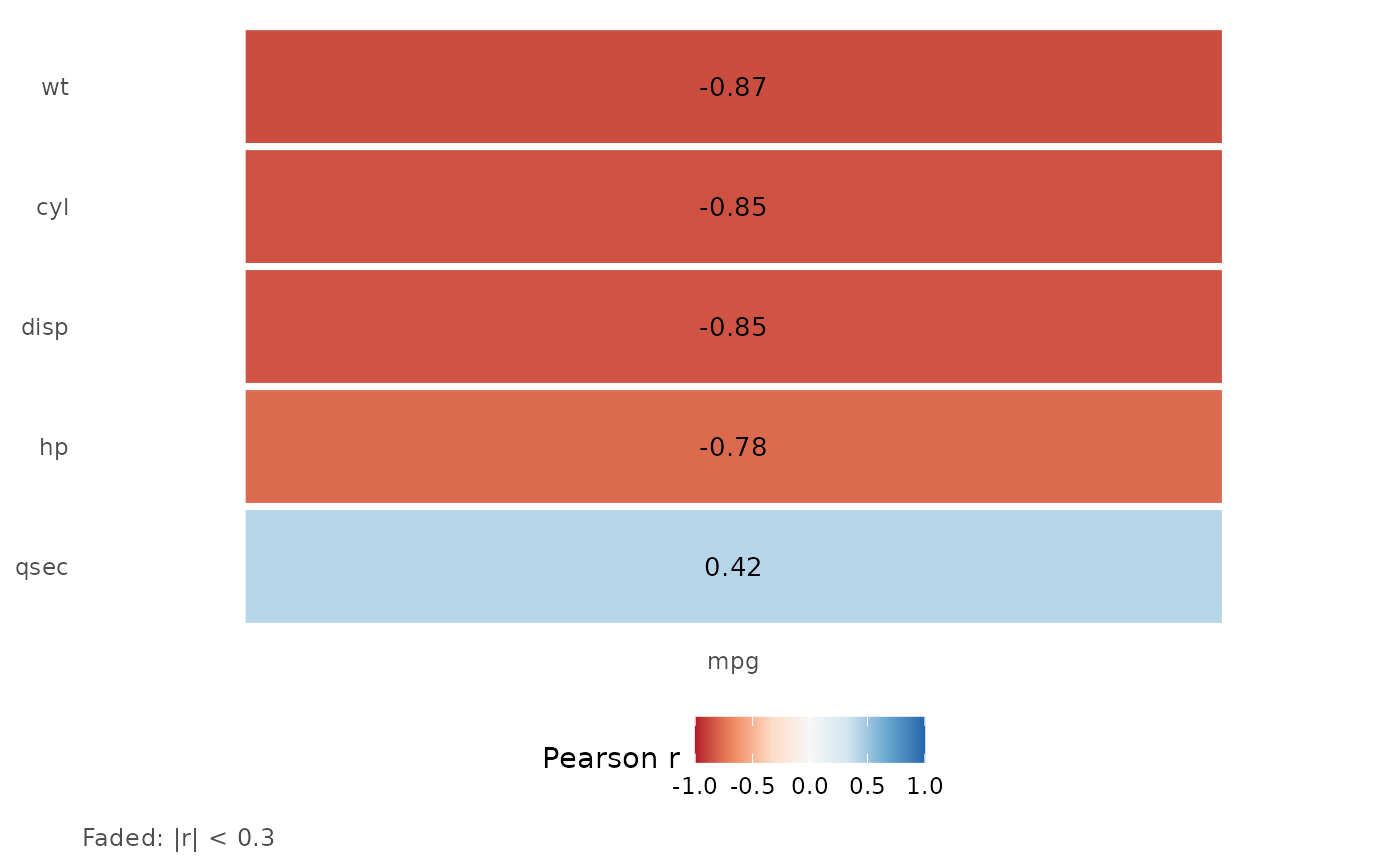
Correlation of One Target With Many Candidate Predictors
Source:R/plot_target_correlation_heatmap.R
plot_target_correlation_heatmap.RdA one-column tile heatmap for screening predictors of a single continuous target: each tile is the correlation of one predictor with the target, with the number printed on it. Tiles with `abs(r) < cutoff` are drawn faded, so the predictors worth a closer look stand out. For a full predictor-by-predictor matrix use [correlation_plot()].
Usage
plot_target_correlation_heatmap(
  data,
  target,
  predictors,
  cutoff = 0.3,
  sort_by_abs = TRUE,
  palette = "RdBu",
  method = c("pearson", "spearman", "kendall"),
  digits = 2
)
Arguments
- data
A data frame.
- target
Name of the numeric target column.
- predictors
Character vector of numeric predictor columns (the target itself is ignored if listed).
- cutoff
Absolute correlation below which a tile is faded (default 0.3; `0` fades nothing).
- sort_by_abs
If `TRUE` (default) the strongest predictor is on top; otherwise the order of `predictors`.
- palette
A diverging ColorBrewer palette name (default `"RdBu"`); the scale is fixed to -1..1.
- method
`"pearson"` (default), `"spearman"` or `"kendall"`.
- digits
Decimals printed on the tiles.
Value
A ggplot2 object. Its `data` holds `predictor`, `r`, `n` (complete pairs) and `faded`. A predictor with fewer than 3 complete pairs or no variation has `r = NA` and is drawn blank.
Examples
plot_target_correlation_heatmap(mtcars, "mpg", c("cyl", "disp", "hp", "wt", "qsec"))