
Scatter Plot With a Regression Line and an Automatic Statistics Sentence
Source:R/plot_scatter_glm.R
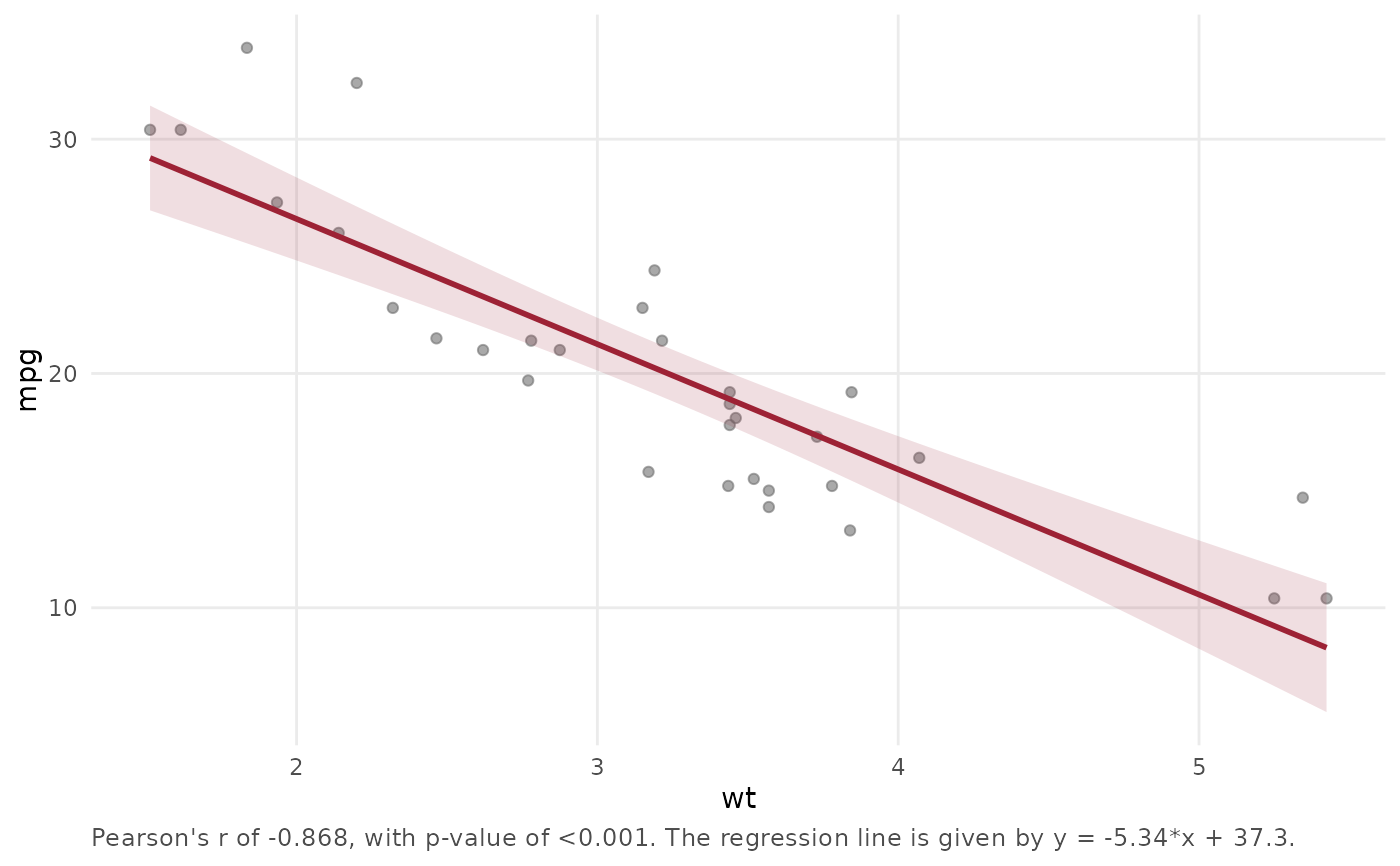
plot_scatter_glm.RdA scatter plot of `y` against `x` with a fitted straight line and confidence band, and, optionally, a sentence reporting Pearson's correlation and the equation of the line: "Pearson's r of 0.52, with p-value of 0.001. The regression line is given by y = 1.2*x + 3.4."
Usage
plot_scatter_glm(
  data,
  x,
  y,
  conf_level = 0.95,
  annotate_stats = TRUE,
  x_label = NULL,
  y_label = NULL,
  facet_by = NULL,
  digits = 3
)
Arguments
- data
A data frame.
- x, y
Names of the numeric columns.
- conf_level
Confidence level of the band (default 0.95).
- annotate_stats
If `TRUE` (default) the sentence is added as the caption (one line per panel when faceting).
- x_label, y_label
Axis labels (default: the column names).
- facet_by
Optional column to facet by.
- digits
Significant digits in the sentence.
Value
A ggplot2 object with attribute `"stats"`, a tibble with `panel`, `n`, `r`, `p.value`, `slope`, `intercept` and `sentence`.
Statistics
Rows with a missing `x` or `y` are dropped. `r` and its p-value come from [stats::cor.test()] (Pearson). The line is the ordinary least-squares fit of `y` on `x` ([stats::lm()], the same as `glm()` with a Gaussian family), drawn with its `conf_level` confidence band for the mean. With fewer than three complete pairs, or no variation in `x` or `y`, the statistics are `NA` and no line is drawn. With `facet_by`, the statistics are computed within each panel.
Examples
plot_scatter_glm(mtcars, "wt", "mpg")
 attr(plot_scatter_glm(mtcars, "wt", "mpg"), "stats")$sentence
#> [1] "Pearson's r of -0.868, with p-value of <0.001. The regression line is given by y = -5.34*x + 37.3."