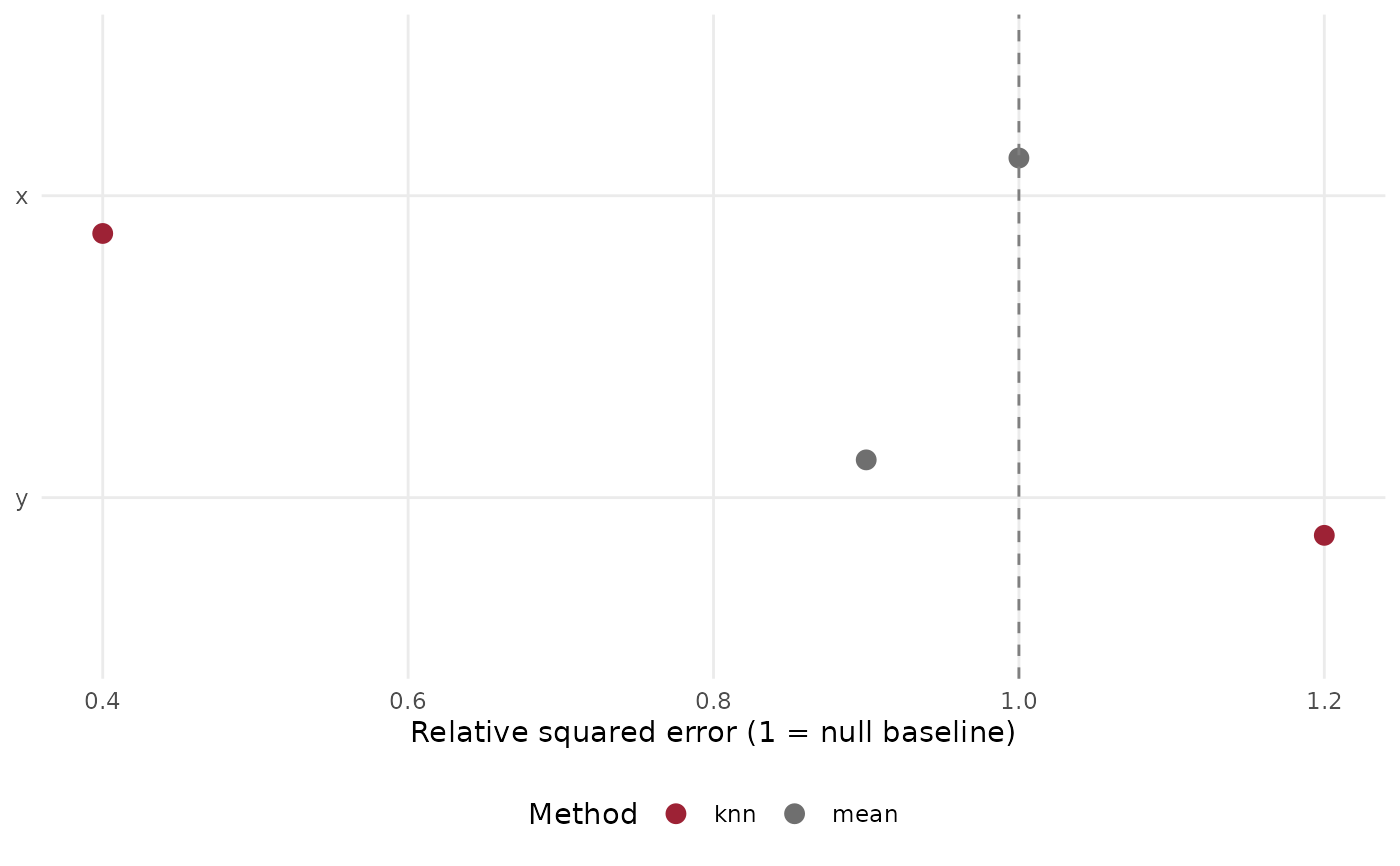
Dot plot of each method's relative squared error (or RMSE) by variable, with the null baseline (RSE = 1) marked.
Usage
plot_rse_by_column(rse_df, metric = c("RSE", "RMSE"), log_scale = FALSE)Examples
rse <- data.frame(variable = c("x", "x", "y", "y"),
                  method = c("mean", "knn", "mean", "knn"), rse = c(1, 0.4, 0.9, 1.2))
plot_rse_by_column(rse)