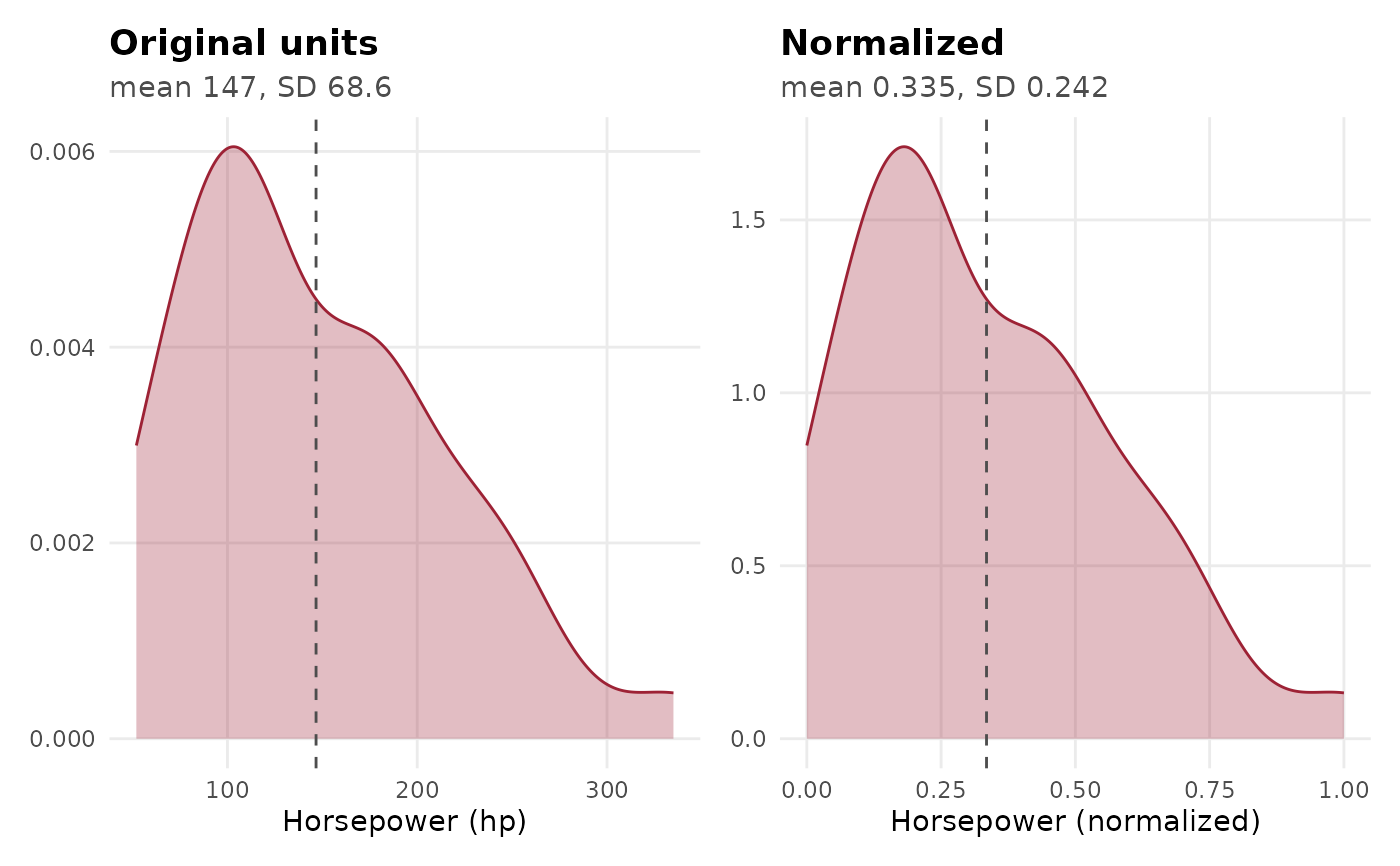
Compare One Variable Before and After Normalization
Source:R/plot_normalization_comparison.R
plot_normalization_comparison.RdTwo panels side by side: the variable in its original units and the same values after rescaling (for example with [min_max_norm()]), each with its mean and standard deviation in the subtitle. Needs the `patchwork` package.
Usage
plot_normalization_comparison(
  raw_vec,
  norm_vec,
  var_label,
  unit_label = NULL,
  type = c("density", "histogram"),
  bins = 30
)
Arguments
- raw_vec, norm_vec
Numeric vectors of the same length: the values before and after normalization. Pairs where either is missing are dropped.
- var_label
Name of the variable for the titles.
- unit_label
Optional unit of the original values (added to the x-axis label).
- type
`"density"` (default) or `"histogram"`.
- bins
Number of histogram bins (default 30).
Examples
x <- mtcars$hp
plot_normalization_comparison(x, min_max_norm(x), "Horsepower", "hp")