
Skip to contents

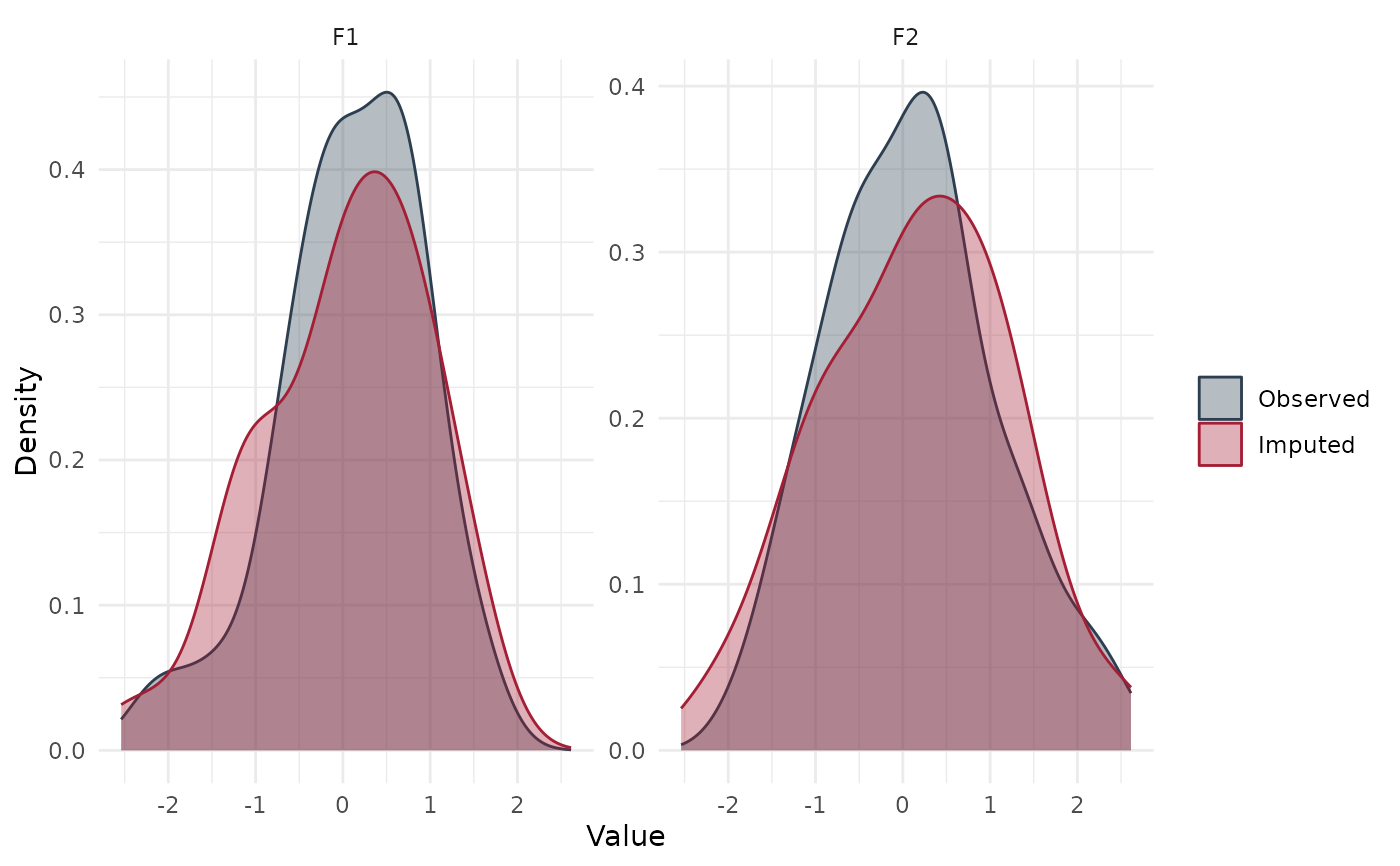
For a validation of an imputation method on cells whose truth is known: for each fold, the observed (true) values and the imputed values side by side as boxplots and/or overlaid densities. `type = "both"` needs the `patchwork` package.

Usage

plot_imputed_vs_observed(
  predictions_df,
  observed_col = "observed",
  imputed_col = "imputed",
  fold_col = "Fold",
  type = c("both", "boxplot", "density"),
  title = NULL
)
Arguments

predictions_df

A data frame with one row per held-out cell.

observed_col, imputed_col, fold_col

Column names.

type

`"both"` (default), `"boxplot"` or `"density"`.

title

Optional title.

Value

A ggplot (`"boxplot"`, `"density"`) or a patchwork of the two (`"both"`). Rows with a missing observed or imputed value are dropped; the long data are in the plot's `data`.

See also

[compare_imputation_rse()], [test_imputed_distributions()]

Examples

set.seed(1)
d <- data.frame(Fold = rep(c("F1", "F2"), each = 50), observed = rnorm(100))
d$imputed <- d$observed + rnorm(100, 0, 0.5)
plot_imputed_vs_observed(d, type = "density")