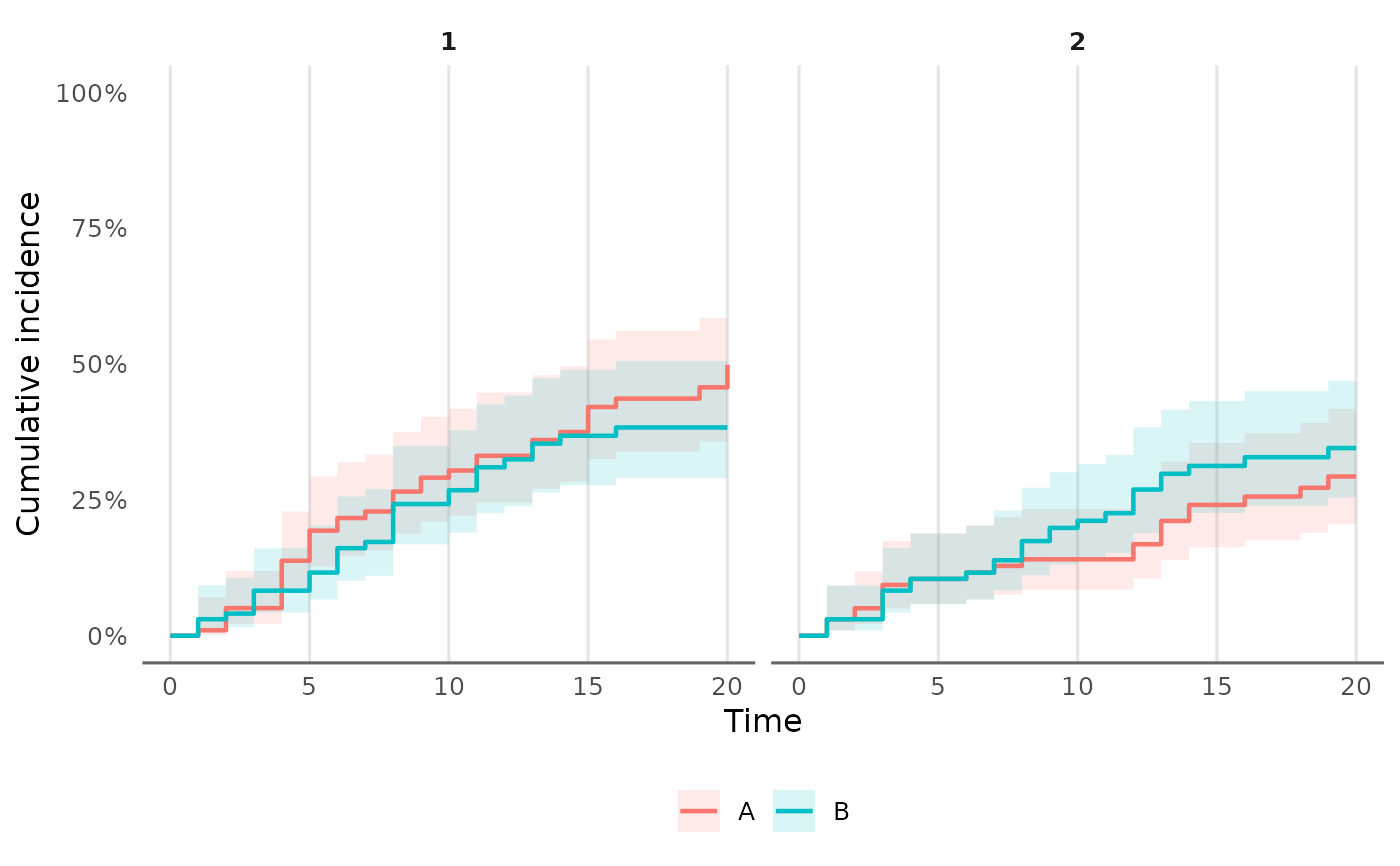
Step curves with shaded pointwise intervals for the output of [tbl_cumulative_incidence()]. Call `tbl_cumulative_incidence()` with a fine grid of `times` (for example every unit of follow-up) for smooth-looking steps; at a handful of times the curves only join those points.
Examples
set.seed(1)
d <- data.frame(time = rexp(200, 0.1), type = sample(0:2, 200, TRUE, prob = c(0.3, 0.4, 0.3)),
                arm = rep(c("A", "B"), 100))
cif <- tbl_cumulative_incidence(d, "time", "type", group_col = "arm", times = seq(0, 20, 1))
plot_cumulative_incidence(cif)