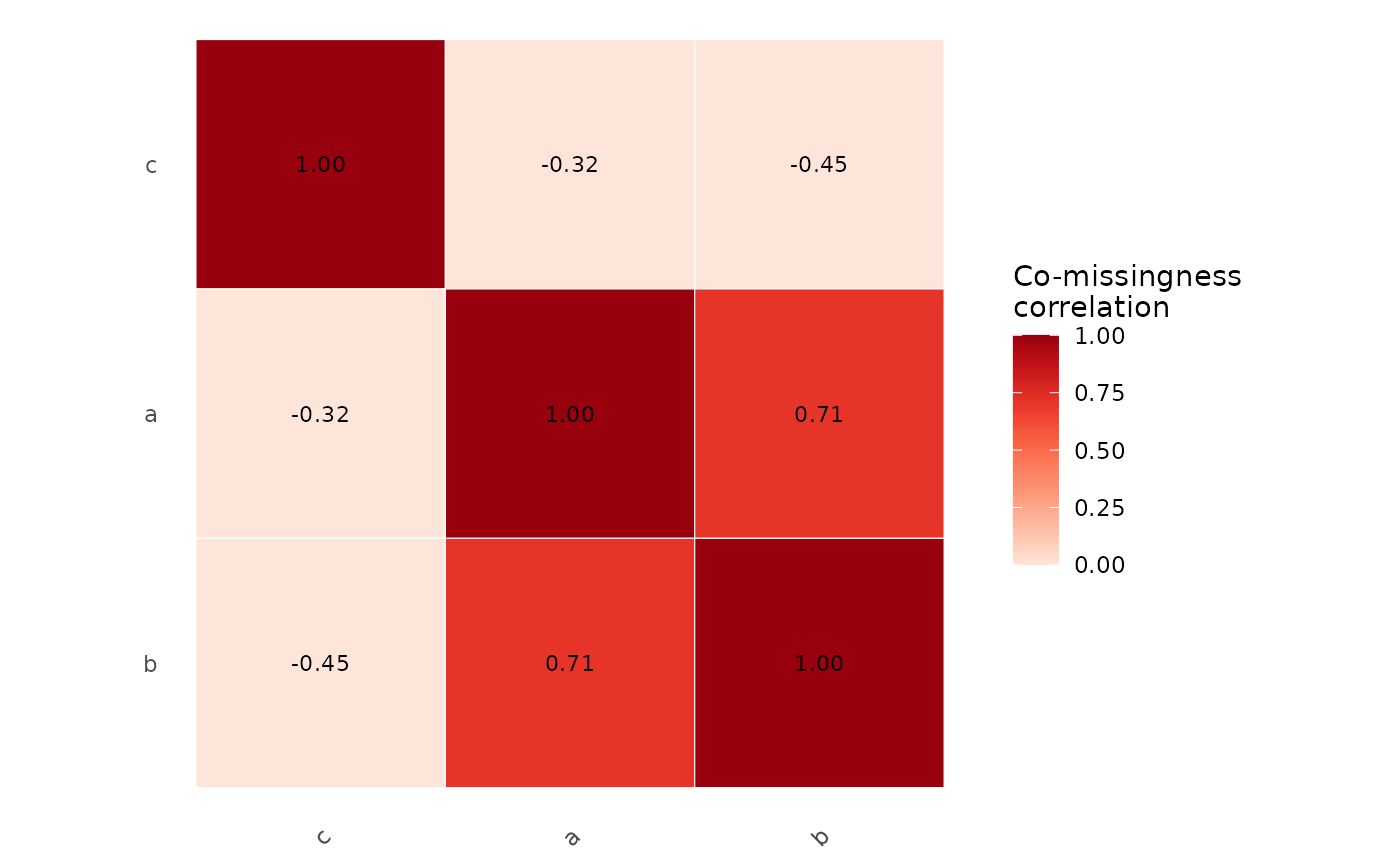
Co-Missingness Correlation Matrix
Source:R/plot_comissingness_matrix.R
plot_comissingness_matrix.RdHeatmap of the correlation between the missingness indicators of columns (1 = missing, 0 = observed). Values near 1 mean two columns are missing together (an instrument or a line that failed and took several measurements with it); values near 0 are consistent with unrelated missingness. With `cluster = TRUE` the columns are ordered by hierarchical clustering of `1 - correlation`.
Usage
plot_comissingness_matrix(
  data,
  vars = NULL,
  cluster = TRUE,
  k = NULL,
  palette = "Reds",
  label = NULL
)
Arguments
- data
A data frame.
- vars
Columns to use (default all).
- cluster
Order the columns by hierarchical clustering (default `TRUE`).
- k
Optional number of clusters to cut the tree into; adds a `cluster` column to the plot data.
- palette
A sequential ColorBrewer palette name (default `"Reds"`); the scale runs 0 to 1 (negative correlations are drawn as 0).
- label
Print the correlation on the tiles (default `TRUE` up to 15 columns).
Details
Columns with no missing value, or only missing values, have no variation in their indicator and are left out (listed in the attribute `"dropped"` of the result).
Examples
d <- data.frame(a = c(1, NA, 3, NA, 5, 6), b = c(1, NA, 3, NA, 5, NA), c = c(NA, 2, 3, 4, 5, 6))
plot_comissingness_matrix(d)