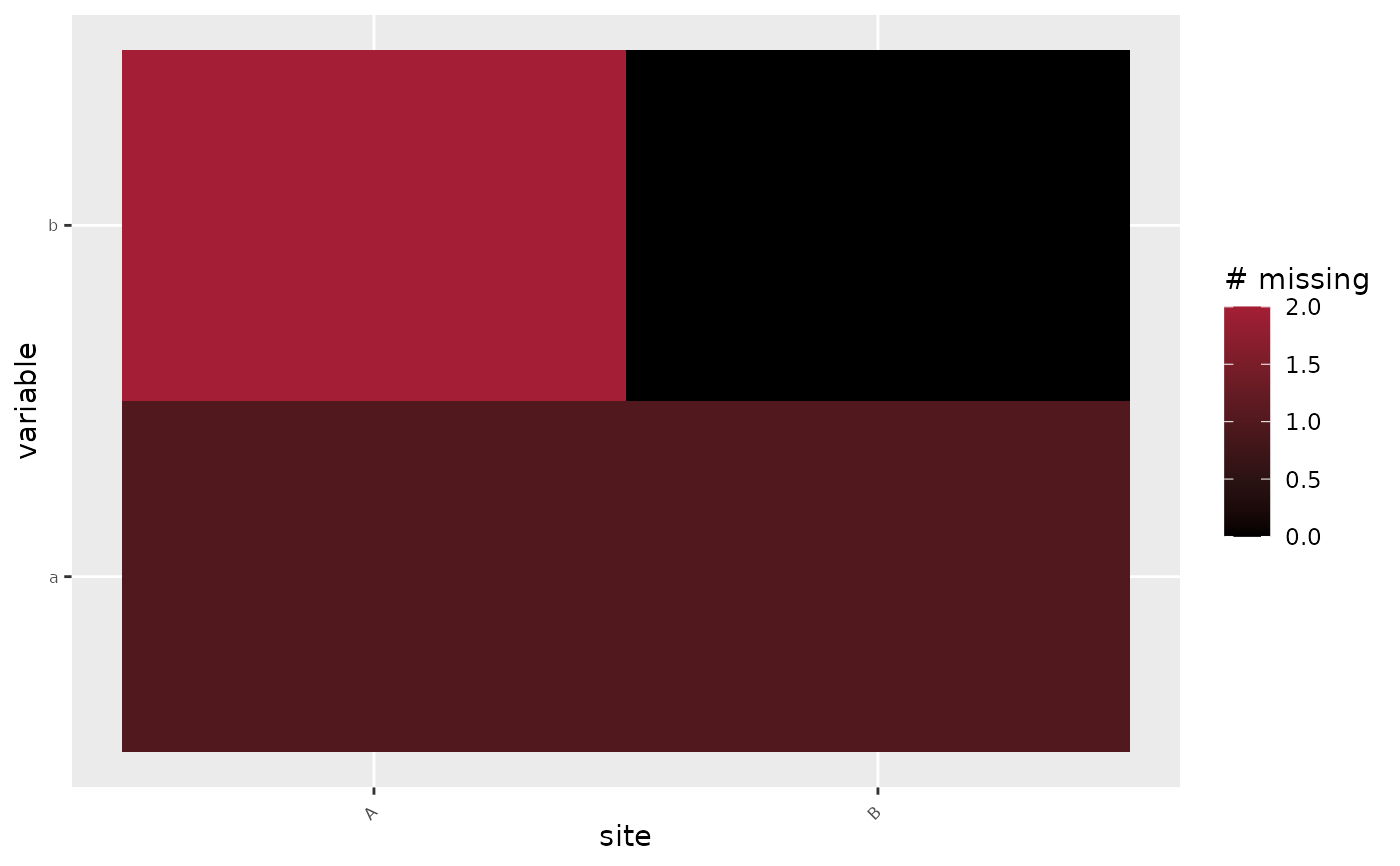
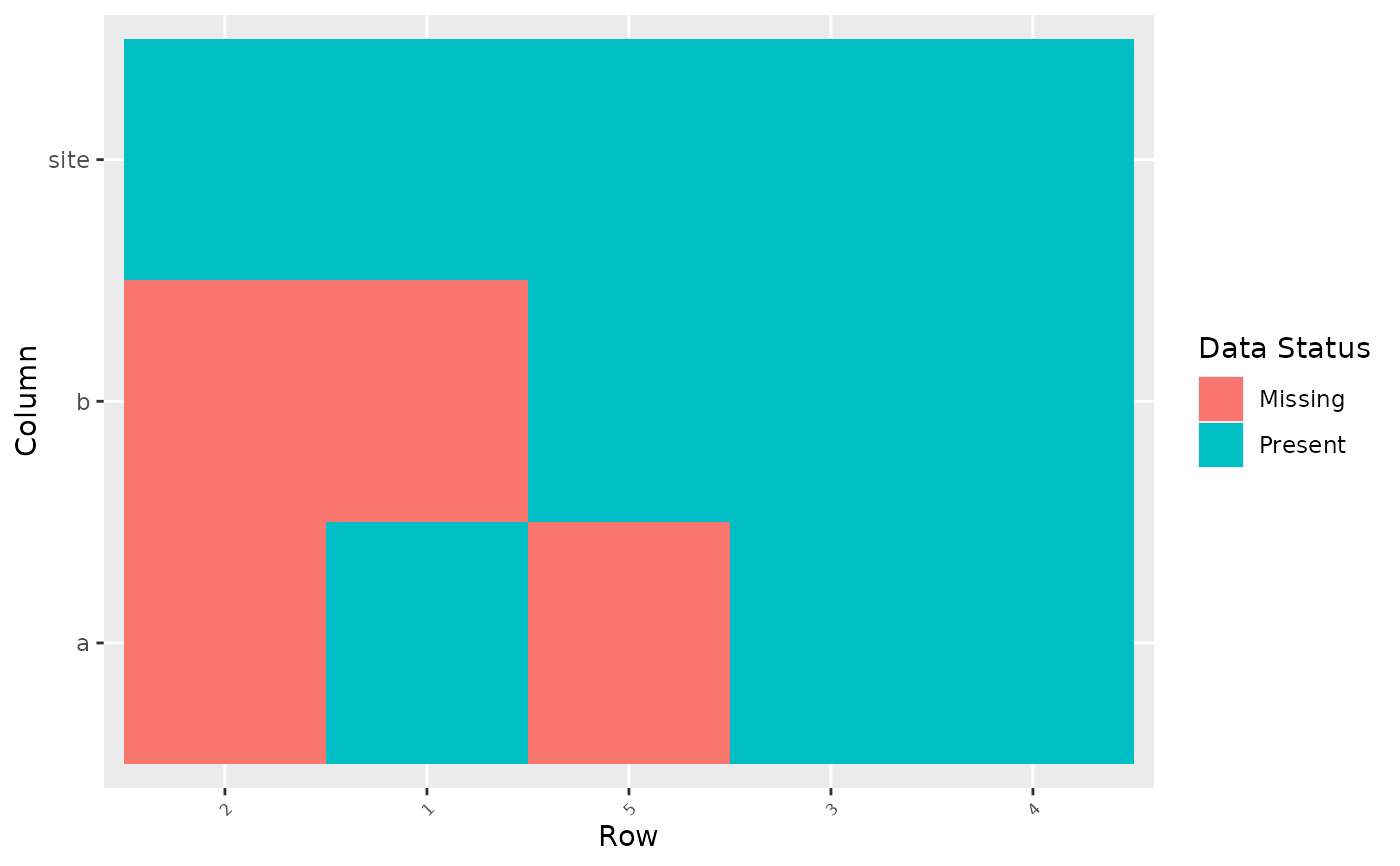
Visualizes missingness across a data frame as a heatmap, either per row/column or aggregated by a grouping column.
Usage
missmap(
  df,
  by_column = NULL,
  na_list = NULL,
  row_order = FALSE,
  fill = c("auto", "binary", "count")
)
Arguments
- df
A data frame or tibble.
- by_column
Optional unquoted column name to aggregate missingness by (e.g. a site or subject id) instead of plotting every row individually. Missingness is summed per feature within each group. When
row_order
= FALSE
, both the groups (x-axis) and the features (y-axis) are ordered by descending total missingness, exactly as in the per-row/column view.- na_list
Optional vector of additional values to treat as missing (beyond actual
NA).- row_order
Logical; if
FALSE(default) rows/features (or, inby_columnmode, groups/features) are ordered by how much missingness they have.- fill
In
by_columnmode, how to color the tiles:"auto"(default) picks a discrete two-level "Missing"/"Present" fill (matching the per-row/column view) when every group has at most one contributing row – in which case the summed missingness count is always 0 or 1 and a count scale would be misleading – and otherwise falls back to a continuous "# missing" gradient."binary"and"count"force one of those two behaviors regardless of group size. Ignored outsideby_columnmode.
Examples
df <- data.frame(
a = c(1, NA, 3, 4, NA),
b = c(NA, NA, 3, 4, 5),
site = c("A", "A", "B", "B", "B")
)
missmap(df)
 missmap(df, by_column = site)