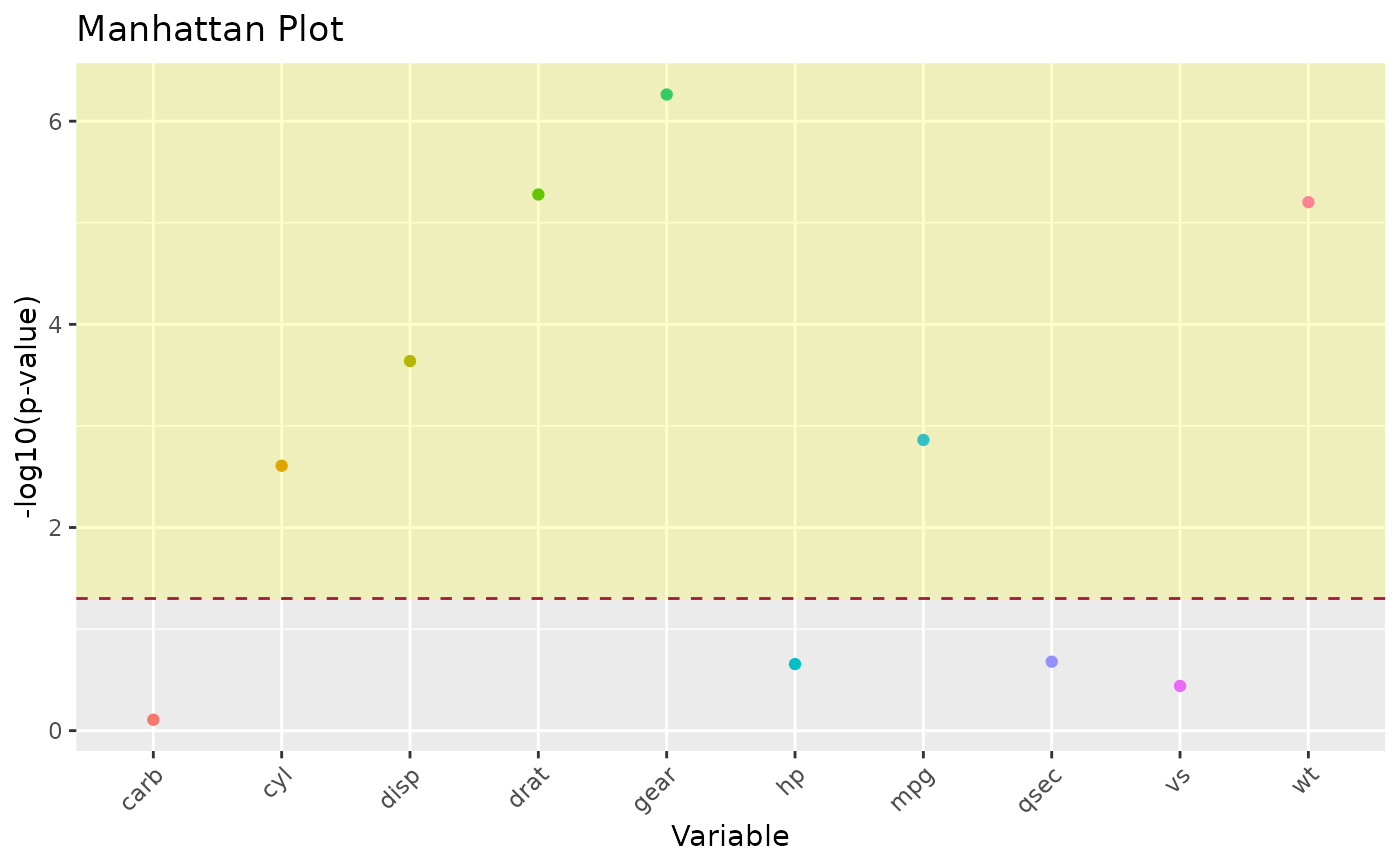
Manhattan Plot
Arguments
- .data
A data frame, e.g. the output of
multiple_t_test.- var
Unquoted column of variable labels.
- log_p
Unquoted column of
-log10(p.value).- alpha
Significance threshold for the reference line/shading (default
0.05).- highlight_significant
Logical (default
TRUE); shade the region above thep < alphaline.
Examples
mtcars |>
  dplyr::mutate(am = factor(am)) |>
  multiple_t_test(.class = "am") |>
  manhattan_plot(var = var, log_p = log_p)