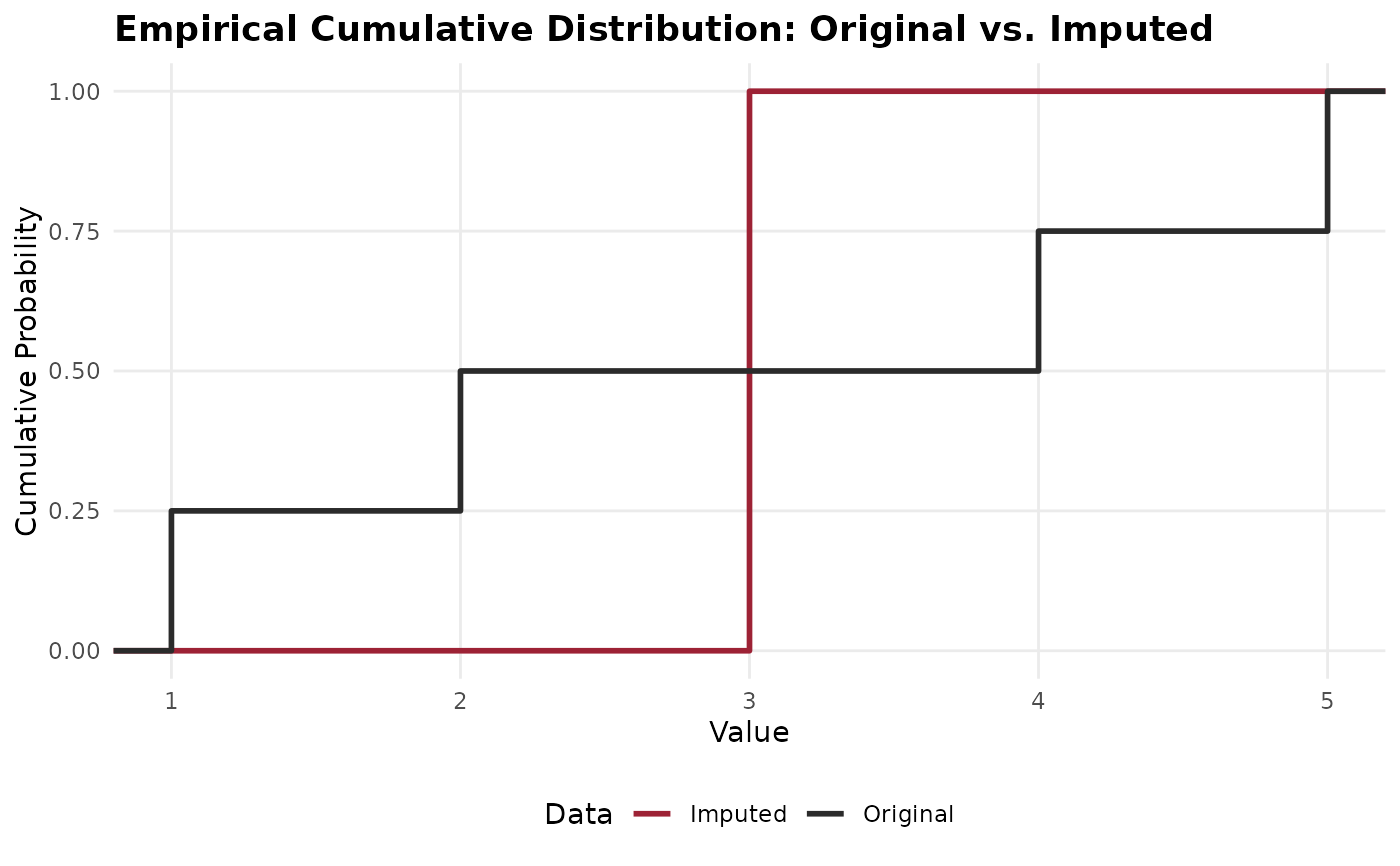
Compare Original vs Imputed Empirical Cumulative Distribution Functions
Source:R/imputation_diagnostics.R
compare_imputed_ecdf.RdOverlays the empirical cumulative distribution function (ECDF) of observed versus imputed values for one or more variables.
Usage
compare_imputed_ecdf(
  orig,
  imp,
  cols,
  colors = c(Original = "#2B2B2B", Imputed = "#9D2235")
)Examples
df_orig <- data.frame(x = c(1, 2, NA, 4, 5))
df_imp <- data.frame(x = c(1, 2, 3, 4, 5))
compare_imputed_ecdf(df_orig, df_imp, cols = "x")