Visualizations for 2-Way Contingency Tables and Categorical Tests
Source:R/plot_pairwise_categorical.R
cbe_contingency_plot.RdGenerates publication-ready clinical visualizations for 2-way contingency tables with hypothesis test statistics (Central Fisher's Exact Test with mid-p adjustment when zero-cells occur, or Pearson Chi-squared test) automatically formatted in the caption.
Usage
cbe_contingency_plot(
  data,
  var1 = NULL,
  var2 = NULL,
  label1 = NULL,
  label2 = NULL,
  type = c("balloon", "bar", "mosaic", "heatmap", "square", "corrplot"),
  bar_position = c("fill", "dodge", "stack"),
  engine = c("ggplot", "corrplot", "ggpubr"),
  test = c("auto", "exact", "chisq", "fisher"),
  correct = FALSE,
  size_range = c(6, 22),
  fill_colors = c("#F4F4F4", "#9D2235"),
  show_counts = TRUE,
  title = NULL,
  caption = NULL,
  p_format = NULL,
  ...
)

contingency_plot(
  data,
  var1 = NULL,
  var2 = NULL,
  label1 = NULL,
  label2 = NULL,
  type = c("balloon", "bar", "mosaic", "heatmap", "square", "corrplot"),
  bar_position = c("fill", "dodge", "stack"),
  engine = c("ggplot", "corrplot", "ggpubr"),
  test = c("auto", "exact", "chisq", "fisher"),
  correct = FALSE,
  size_range = c(6, 22),
  fill_colors = c("#F4F4F4", "#9D2235"),
  show_counts = TRUE,
  title = NULL,
  caption = NULL,
  p_format = NULL,
  ...
)

balloon_plot(
  data,
  var1 = NULL,
  var2 = NULL,
  label1 = NULL,
  label2 = NULL,
  engine = c("ggplot", "corrplot", "ggpubr"),
  size_range = c(6, 22),
  fill_colors = c("#F4F4F4", "#9D2235"),
  show_counts = TRUE,
  title = NULL,
  ...
)

bar_plot(
  data,
  var1 = NULL,
  var2 = NULL,
  label1 = NULL,
  label2 = NULL,
  bar_position = c("fill", "dodge", "stack"),
  show_counts = TRUE,
  title = NULL,
  ...
)

mosaic_plot(
  data,
  var1 = NULL,
  var2 = NULL,
  label1 = NULL,
  label2 = NULL,
  show_counts = TRUE,
  title = NULL,
  ...
)

heatmap_plot(
  data,
  var1 = NULL,
  var2 = NULL,
  label1 = NULL,
  label2 = NULL,
  fill_colors = c("#F4F4F4", "#9D2235"),
  show_counts = TRUE,
  title = NULL,
  ...
)

four_quadrant_report(
  data,
  var1 = NULL,
  var2 = NULL,
  label1 = NULL,
  label2 = NULL,
  test = c("auto", "exact", "chisq", "fisher"),
  correct = FALSE,
  p_format = NULL,
  ...
)

square_plot(
  data,
  var1 = NULL,
  var2 = NULL,
  label1 = NULL,
  label2 = NULL,
  test = c("auto", "exact", "chisq", "fisher"),
  correct = FALSE,
  engine = c("ggplot", "corrplot"),
  size_range = c(6, 22),
  fill_colors = c("#F4F4F4", "#9D2235"),
  show_counts = TRUE,
  title = NULL,
  caption = NULL,
  p_format = NULL,
  ...
)
Arguments
- data
A data frame containing the categorical variables, or a 2-way table/matrix.
- var1
Character string of the row variable column name (ignored if
datais a table).- var2
Character string of the column variable column name (ignored if
datais a table).- label1
Optional display label for
var1(defaults tovar1).- label2
Optional display label for
var2(defaults tovar2).- type
Visualization type:
"balloon"(default),"bar","mosaic","heatmap","square", or"corrplot".- bar_position
Position adjustment when
type = "bar":"fill"(100% proportional stacked bar, default),"dodge"(side-by-side grouped), or"stack"(count stacked).- engine
Engine for balloon/square rendering:
"ggplot"(default),"corrplot", or"ggpubr".- test
Hypothesis test engine:
"auto"(default CBE hierarchy),"exact"(force Central Fisher exact test for 2x2 or simulated Fisher for RxC),"chisq"(force Pearson's Chi-squared test viachisq.test), or"fisher"(forcefisher.test).- correct
Logical; whether to apply continuity correction when
test = "chisq"(defaultFALSEfollowing CBE standard protocol).- size_range
Numeric vector of length 2 giving min and max glyph sizes for balloon and square plots (default
c(6, 22)).- fill_colors
Character vector of colors for the palette or gradient. Defaults to Temple University brand palette (
c("#F4F4F4", "#9D2235")).- show_counts
Logical (default
TRUE); whether to print cell counts inside plots.- title
Plot title. If
NULL, defaults to"{label1} \u00d7 {label2}".- caption
Optional plot caption. If
NULL, automatically computed and formatted usingpformatwith test description.- p_format
Optional p-value formatting function (default
pformat).- ...
Additional arguments passed to underlying plotting functions.
Value
A ggplot object (for "balloon", "bar", "mosaic", "heatmap", "square"),
or invisibly the contingency table (for "corrplot").
Details
Supported visualization types:
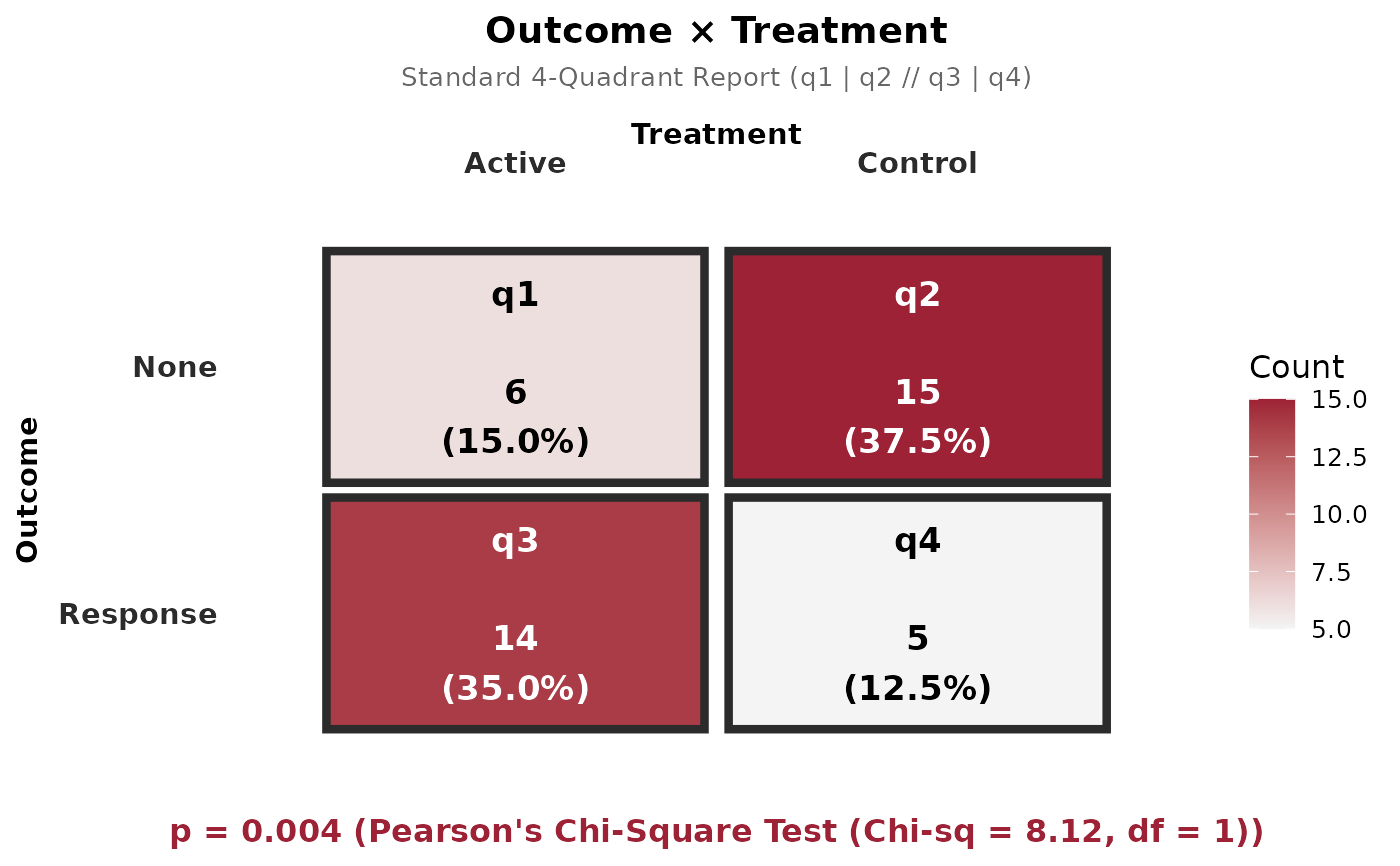
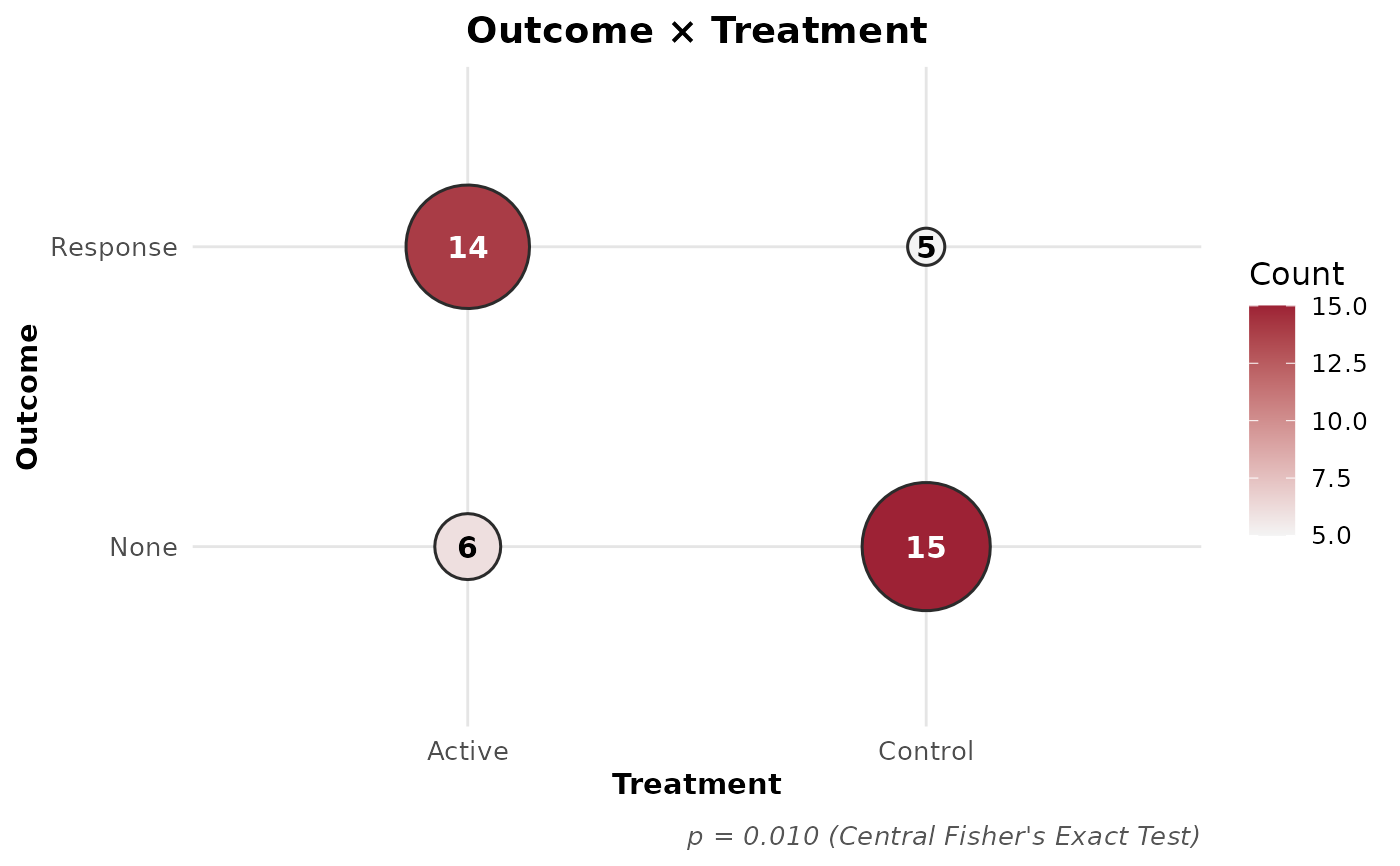
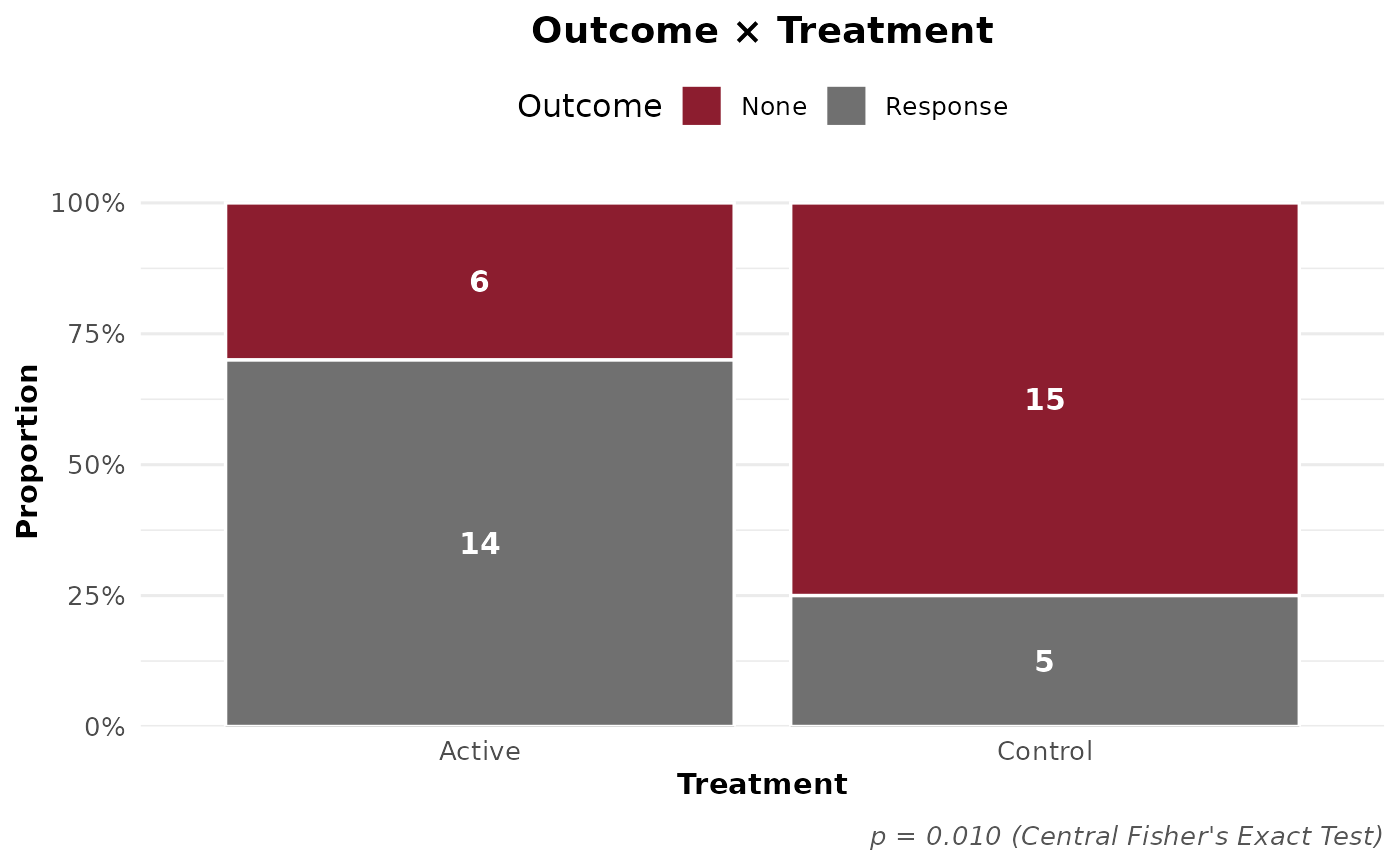
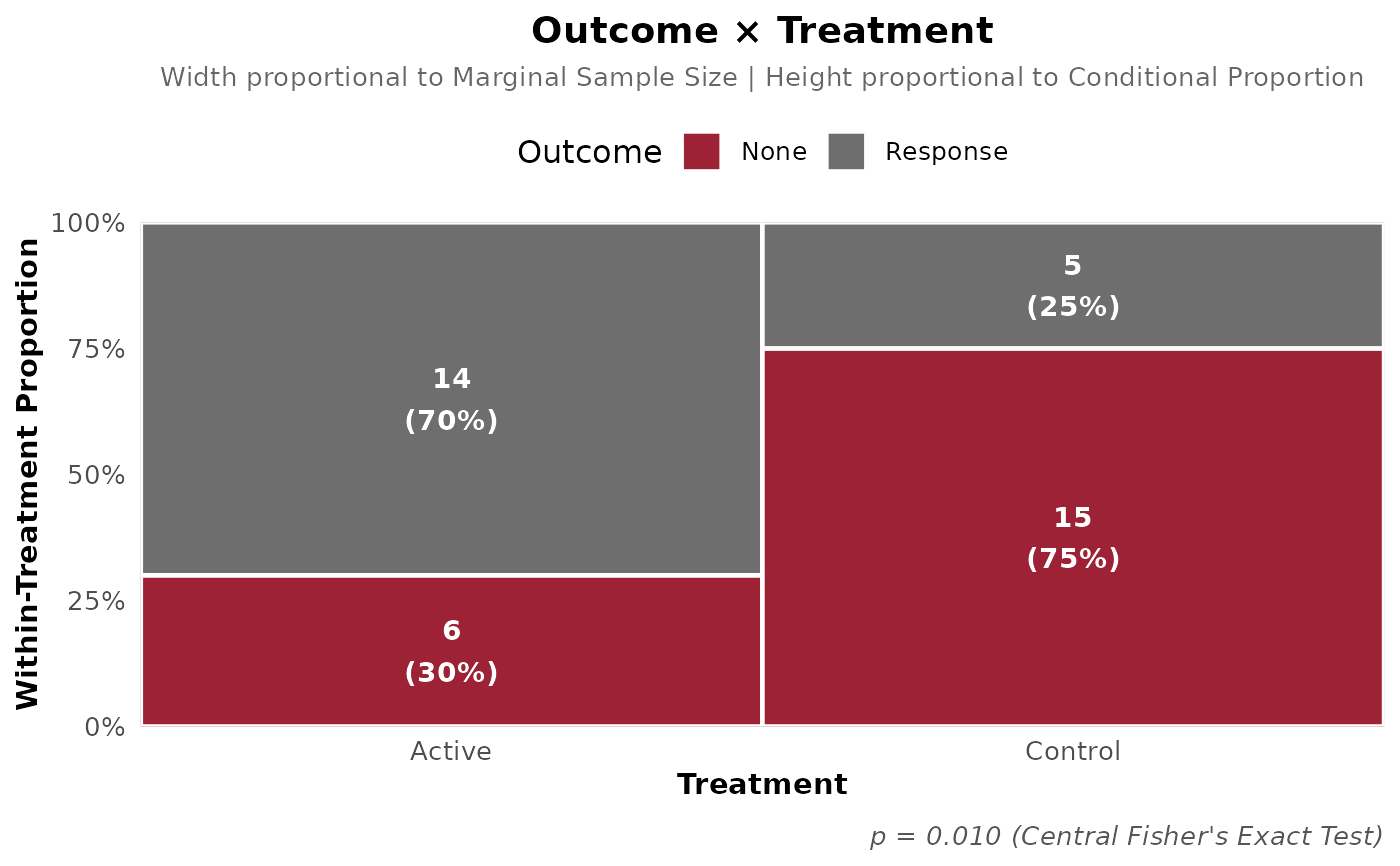
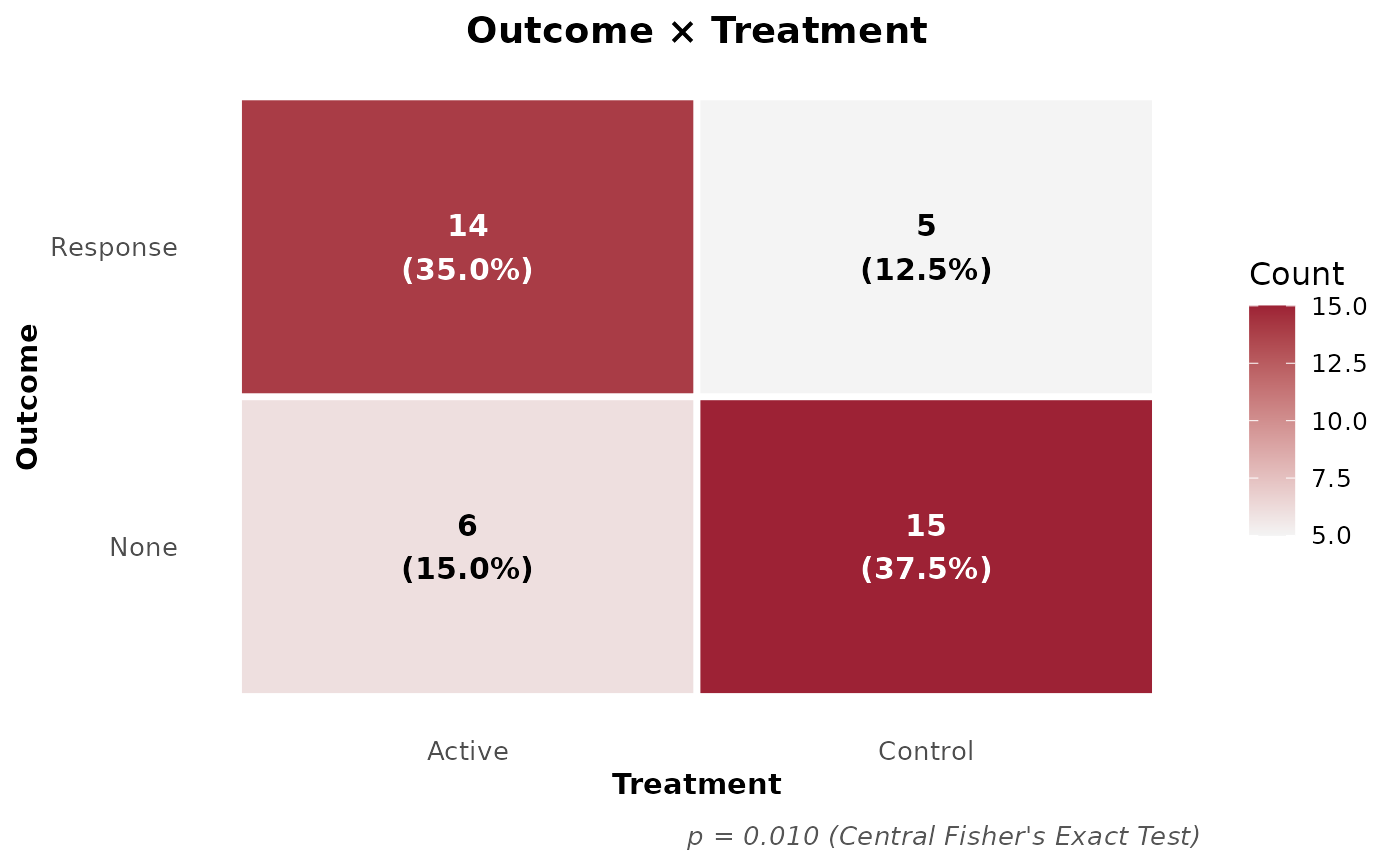
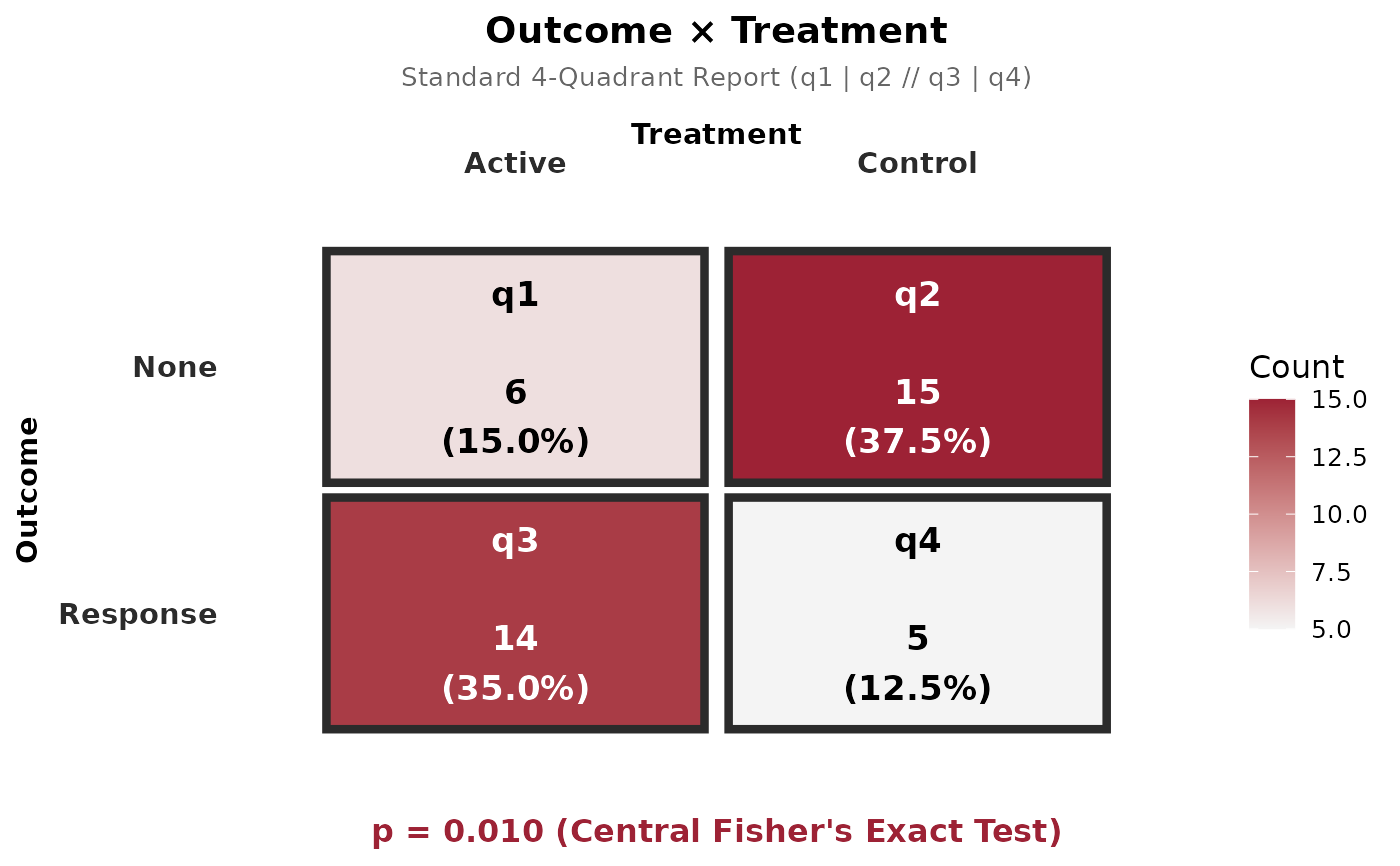
"balloon"(default): Proportional bubble/circle plot with counts displayed inside circles."bar": Grouped, stacked, or 100% proportional fill bar chart."mosaic": Two-dimensional mosaic plot with tile area proportional to joint frequency."heatmap": Shaded tile heatmap with cell frequencies and overall percentages."square": Standard 4-quadrant report for 2x2 tables (q1 | q2 // q3 | q4 // p = pformat), or proportional square tiles for RxC tables."corrplot": Circular or square matrix plot rendered via corrplot.
Examples
df <- data.frame(
Treatment = factor(c(rep("Active", 20), rep("Control", 20))),
Outcome = factor(c(rep("Response", 14), rep("None", 6),
rep("Response", 5), rep("None", 15)))
)
# 1. Balloon Plot (Temple Brand Colors)
cbe_contingency_plot(df, "Outcome", "Treatment", type = "balloon")
 # 2. Proportional Bar Plot (100% Fill)
cbe_contingency_plot(df, "Outcome", "Treatment", type = "bar", bar_position = "fill")
 # 3. Mosaic Plot
cbe_contingency_plot(df, "Outcome", "Treatment", type = "mosaic")
 # 4. Heatmap
cbe_contingency_plot(df, "Outcome", "Treatment", type = "heatmap")
 # 5. Standard 4-Quadrant Square Plot (q1 | q2 // q3 | q4 // p = pformat)
cbe_contingency_plot(df, "Outcome", "Treatment", type = "square")
 # 6. Force Pearson Chi-Square Test
cbe_contingency_plot(df, "Outcome", "Treatment", type = "square", test = "chisq")